I have written a new report that’s just been released: US Census Data: Concepts and Applications for Supporting Research, was published as the May / June 2022 issue of the American Library Association’s Library and Technology Reports. It’s available for purchase digitally or in hard copy from the ALA from now through next year. It will also be available via EBSCOhost as full text, sometime this month. One year from now, the online version will transition to become a free and open publication available via the tech report archives.
The report was designed to be a concise primer (about 30 pages) for librarians who want to be knowledgeable with assisting researchers and students with finding, accessing, and using public summary census data, or who want to apply it to their own work as administrators or LIS researchers. But I also wrote it in such a way that it’s relevant for anyone who is interested in learning more about the census. In some respects it’s a good distillation of my “greatest hits”, drawing on work from my book, technical census-related blog posts, and earlier research that used census data to study the distribution of public libraries in the United States.
Chapter Outline
Introduction
Roles of the Census: in American society, the open data landscape, and library settings
Census Concepts: geography, subject categories, tables and universes
Datasets: decennial census, American Community Survey, Population Estimates, Business Establishments
Accessing Data: data.census.gov, API with python, reports and data summaries
GIS, historical research, and microdata: covers these topics plus the Current Population Survey
The Census in Library Applications: overview of the LIS literature on site selection analysis and studying library access and user populations
I’m pleased with how it turned out, and in particular I hope that it will be used by MLIS students in data services and government information courses.
Although… I must express my displeasure with the ALA. The editorial team for the Library Technology Reports was solid. But once I finished the final reviews of the copy edits, I was put on the spot to write a short article for the American Libraries magazine, primarily to promote the report. This was not part of the contract, and I was given little direction and a month at a busy time of the school year to turn it around. I submitted a draft and never heard about it again – until I saw it in the magazine last week. They cut and revised it to focus on a narrow aspect of the census that was not the original premise, and they introduced errors to boot! As a writer I have never had an experience where I haven’t been given the opportunity to review revisions. It’s thoroughly unprofessional, and makes it difficult to defend the traditional editorial process as somehow being more accurate or thorough compared to the web posting and tweeting masses. They were apologetic, and are posting corrections. I was reluctant to contribute to the magazine to begin with, as I have a low opinion of it and think it’s deteriorated in recent years, but that’s a topic for a different discussion.
Stepping off the soapbox… I’ll be attending the ALA annual conference in DC later this month, to participate on a panel that will discuss the 2020 census, and to reconnect with some old colleagues. So if you want to talk about the census, you can buy me some coffee (or beer) and check out the report.
A final research and publication related note – the map that appears at the top of my post on the distribution of US public libraries from several years back has also made it into print. It appears on page 173 of The Argument Toolbox by K.J. Peters, published by Broadview Press. It was selected as an example of using visuals for communicating research findings, making compelling arguments in academic writing, and citing underlying sources to establish credibility. I’m browsing through the complimentary copy I received and it looks excellent. If you’re an academic librarian or a writing center professional and are looking for core research method guides, I would recommend checking it out.
Last week, the Census Bureau released the latest 5-year estimates for the American Community Survey for 2016-2020. This latest dataset uses the new 2020 census geography, which means if you’re focused on using the latest data, you can finally move away from the 2010-based geography which had been used for the ACS from 2010 to 2019 (with some caveats: 2020 ZCTAs won’t be utilized until the 2021 ACS, and 2020 PUMAs until 2022). As always, mappers have a choice between the TIGER Line files that depict the precise boundaries, or the generalized cartographic boundary files with smoothed lines and large sections of coastal water bodies removed to depict land areas. The 2016-2020 ACS data is available via data.census.gov and the ACS API.
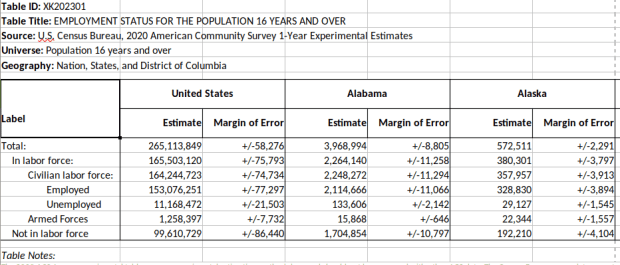
This release is over 3 months late (compared to normal), and there was some speculation as to whether it would be released at all. The pandemic (chief among several other disruptive events) hampered 2020 decennial census and ACS operations. The 1-year 2020 ACS numbers were released over 2 months later than usual, in late November 2021, and were labeled as an experimental release. Instead of the usual 1,500 plus tables in 40 subject areas for all geographic areas with over 65,000 people, only 54 tables were released for the 50 states plus DC. This release is only available from the experimental tables page and is not being published via data.census.gov.
What happened? The details were published in a working paper, but in summary fewer addresses were sampled and the normal mail out and follow-up procedures were disrupted (pg 8). The overall sample size fell from 3.5 to 2.9 million addresses due to reduced mailing between April and June 2020 (pg 18), and total interviews fell from 2 million to 1.4 million with most of the reductions occurring in spring and summer (pg 18). The overall housing unit response rate for 2020 was 71%, down from 86% in 2019 and 92% in 2018 (pg 20). The response rate for the group quarters population fell from 91% in 2019 to 47% in 2020 (pg 21). Responses were differential, varying by time period (with the lowest rates during the peak pandemic months) and geography. Of the 818 counties that meet the 65k threshold, response rates in some were below 50% (pg 21). The data contained a large degree of non-response bias, where people who did respond to the survey had significantly different social, economic and housing characteristics from those who didn’t. As a consequence of all of this, margins of error for the data increased by 20 to 30% over normal (pg 18).
Thus, 2020 will represent a hole in the ACS estimates series. The Bureau made adjustments to weighting mechanisms to produce the experimental 1-year estimates, but is generally advising policy makers and researchers who normally use this series to choose alternatives: either the 1-year 2019 ACS, or the 5-year 2016-2020 ACS. The Bureau was able to make adjustments to produce satisfactory 5-year estimates to reduce non-response bias, and the 5-year pool of samples is balanced somewhat by having at least 4 years of good data.
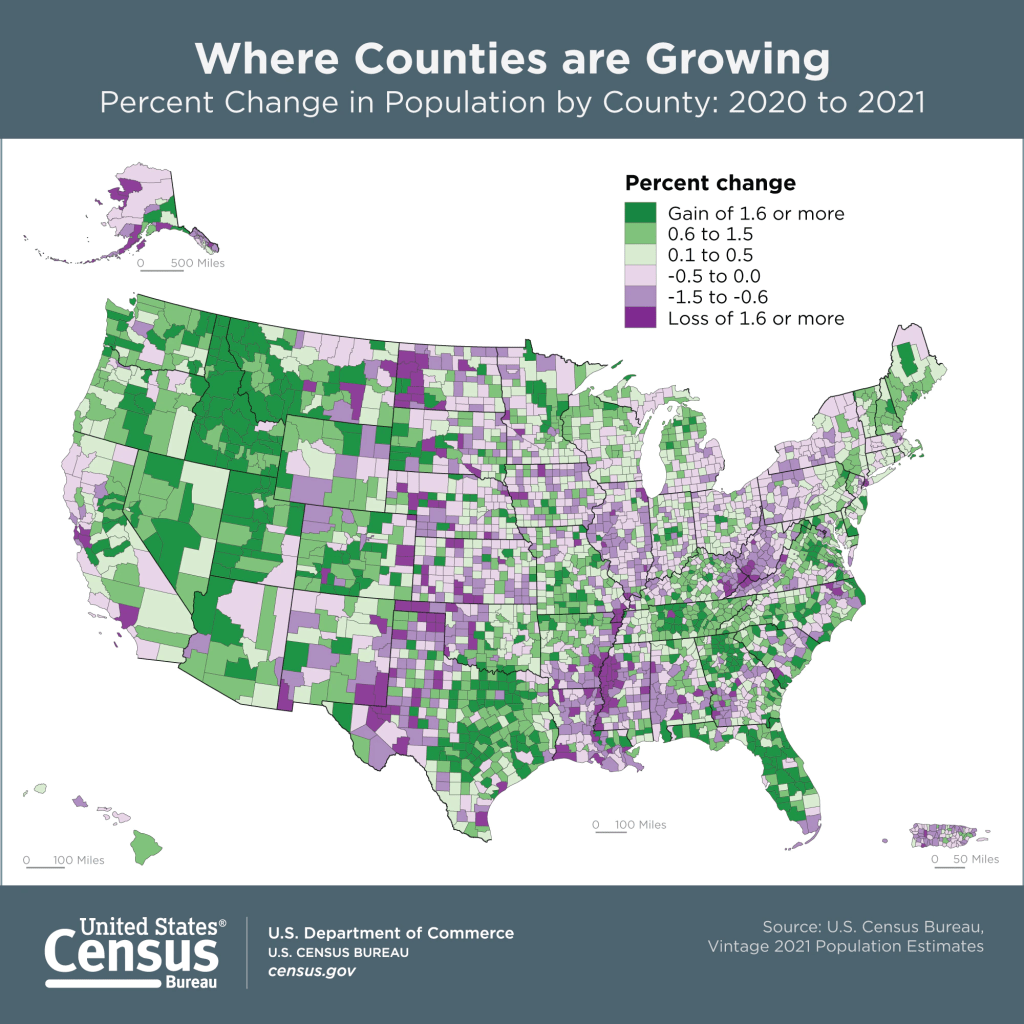
The Population Estimates Program has also released its latest series of vintage 2021 estimates for counties and metropolitan areas. This dataset gives us a pretty sharp view of how the pandemic affected the nation’s population. Approximately 73% of all counties experienced natural decrease in 2021 (between July 1st 2020 and 2021), where the number of deaths outnumbered births. In contrast, 56% of counties had natural decrease in 2020 and 46% in 2019. Declining birth rates and increasing death rates are long term trends, but COVID-19 magnified them, given the large number of excess deaths on one hand and families postponing child birth due to the virus on the other hand. Net foreign migration continued its years-long decline, but net domestic migration increased in a number of places, reflecting pandemic moves. Medium to small counties benefited most, as did large counties in the Sunbelt and Mountain West. The biggest losers in overall population were counties in California (Los Angeles, San Francisco, and Alameda), Cook County (Chicago), and the counties that constitute the boroughs of NYC.
In late summer and early fall I was hammering out the draft for an ALA Tech Report on using census data for research (slated for release early 2022). The earliest 2020 census figures have been released and there are several issues surrounding this, so I’ll provide a summary of what’s happening here. Throughout this post I link to Census Bureau data sources, news bulletins, and summaries of trends, as well as analysis on population trends from Bill Frey at Brookings and reporting from Hansi Lo Wang and his colleagues at NPR.
Count Result and Reapportionment Numbers
The re-apportionment results were released back in April 2020, which provided the population totals for the US and each of the states that are used to reallocate seats in Congress. This data is typically released at the end of December of the census year, but the COVID-19 pandemic and political interference in census operations disrupted the count and pushed all the deadlines back.
Despite these disruptions, the good news is that the self-response rate, which is the percentage of households who submit the form on their own without any prompting from the Census Bureau, was 67%, which is on par with the 2010 census. This was the first decennial census where the form could be submitted online, and of the self-responders 80% chose to submit via the internet as opposed to paper or telephone. Ultimately, the Bureau said it reached over 99% of all addresses in its master address file through self-response and non-response follow-ups.
The bad news is that the rate of non-response to individual questions was much higher in 2020 than in 2010. Non-responses ranged from a low of 0.52% for the total population count to a high of 5.95% for age or date of birth. This means that a higher percentage of data will have to be imputed, but this time around the Bureau will rely more on administrative records to fill the gaps. They have transparently posted all of the data about non-response for researchers to scrutinize.
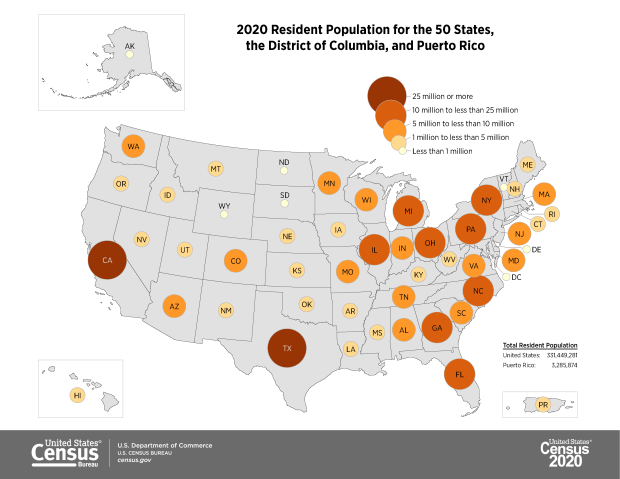
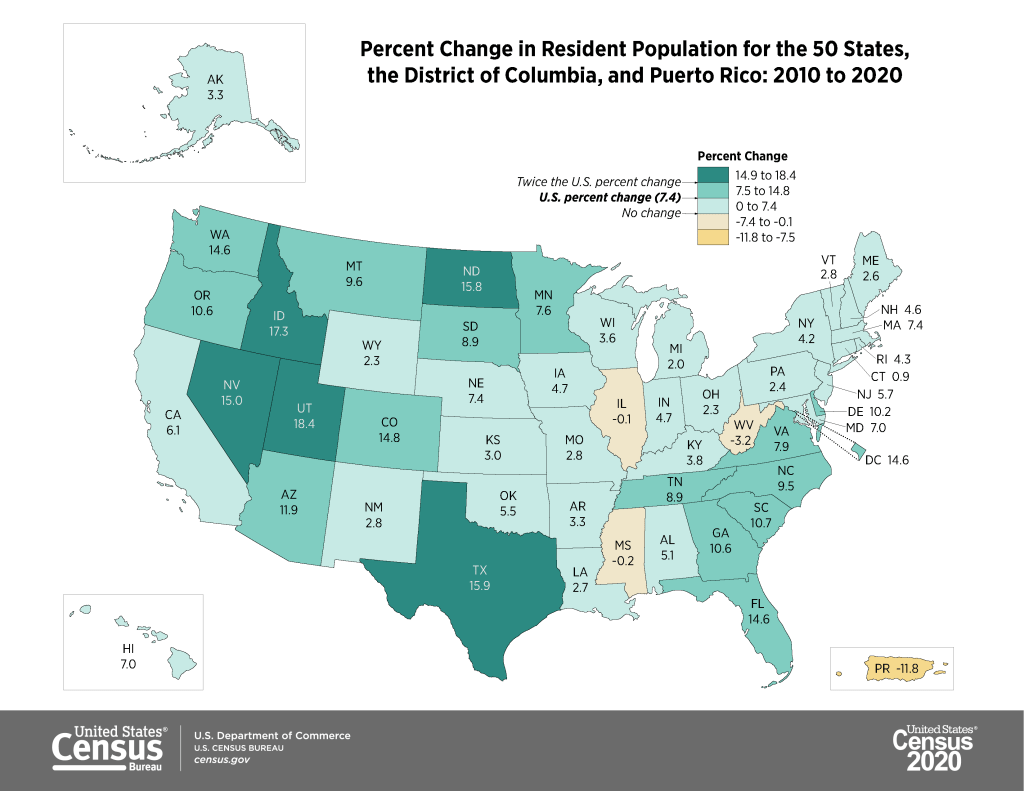
The apportionment results showed that the population of the US grew from approximately 309 million in 2010 to 331 million in 2020, a growth rate of 7.35%. This is the lowest rate of population growth since the 1940 census that followed the Great Depression. Three states lost population (West Virginia, Mississippi, and Illinois), which is the highest number since the 1980 census. The US territory of Puerto Rico lost almost twelve percent of its population. Population growth continues to be stronger in the West and South relative to the Northeast and Midwest, and the fastest growing states are in the Mountain West.
The first detailed population statistics were released as part of the redistricting data file, PL 94-171. Data in this series is published down to the block level, the smallest geography available, so that states can redraw congressional and other voting districts based on population change. Normally released at the end of March, this data was released in August 2021. This is a small package that contains the following six tables:
P1. Race (includes total population count)
P2. Hispanic or Latino, and Not Hispanic or Latino by Race
P3. Race for the Population 18 Years and Over
P4. Hispanic or Latino, and Not Hispanic or Latino by Race for the Population 18 Years and Over
P5. Group Quarters Population by Major Group Quarters Type
H1. Occupancy Status (includes total housing units)
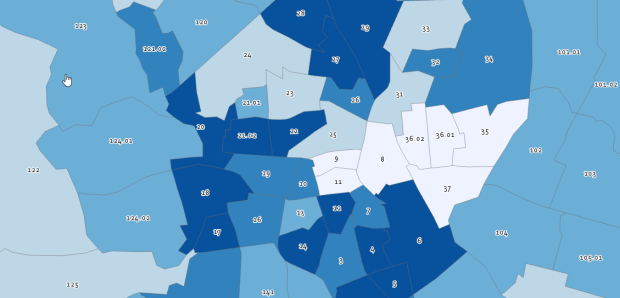
The raw data files for each state can be downloaded from the 2020 PL 94-171 page and loaded into stats packages or databases. That page also provides infographics (including the maps embedded in this post) and data summaries. Data tables can be readily accessed via data.census.gov, or via IPUMS NHGIS.
The redistricting files illustrate the increasing diversity of the United States. The number of people identifying as two or more races has grown from 2.9% of the total population in 2010 to 10.2% in 2020. Hispanics and Latinos continue to be the fastest growing population group, followed by Asians. The White population actually shrank for the first time in the nation’s history, but as NPR reporter Hansi-Lo Wang and his colleagues illustrate this interpretation depends on how one measures race; as race alone (people of a single race) or persons of any race (who selected white and another race), and whether or not Hispanic-whites are included with non-Hispanic whites (as Hispanic / Latino is not a race, but is counted separately as an ethnicity, and most Hispanics identify their race as White or Other). The Census Bureau has also provided summaries using the different definitions. Other findings: the nation is becoming progressively older, and urban areas outpaced rural ones in population growth. Half of the counties in the US lost population between 2010 and 2020, mostly in rural areas.
2020 Demographic and Housing Characteristics and the ACS
There still isn’t a published timeline for the release of the full results in the Demographic and Housing Characteristics File (DHC – known as Summary File 1 in previous censuses, I’m not sure if the DHC moniker is replacing the SF1 title or not). There are hints that this file is going to be much smaller in terms of the number of tables, and more limited in geographic detail compared to the 2010 census. Over the past few years there’s been a lot of discussion about the new differential privacy mechanisms, which will be used to inject noise into the data. The Census Bureau deemed this necessary for protecting people’s privacy, as increased computing power and access to third party datasets have made it possible to reverse engineer the summary census data to generate information on individuals.
What has not been as widely discussed is that many tables will simply not be published, or will only be summarized down to the county-level, also for the purpose of protecting privacy. The Census Bureau has invited the public to provide feedback on the new products and has published a spreadsheet crosswalking products from 2010 and 2020. IPUMS also released a preliminary list of tables that could be cut or reduced in specificity (derived from the crosswalk), which I’m republishing at the bottom of this post. This is still preliminary, but if all these changes are made it would drastically reduce the scope and specificity of the decennial census.
And then… there is the 2020 American Community Survey. Due to COVID-19 the response rates to the ACS were one-third lower than normal. As such, the sample is not large or reliable enough to publish the 1-year estimate data, which is typically released in September. Instead, the Census will publish a smaller series of experimental tables for a more limited range of geographies at the end of November 2021. There is still no news regarding what will happen with the 5-year estimate series that is typically released in December.
Needless to say, there’s no shortage of uncertainty regarding census data in 2020.
Tables in 2010 Summary File 1 that Would Have Less Geographic Detail in 2020(Proposed)
Table Name
Proposed 2020 Lowest Level of Geography
2010 Lowest Level of Geography
Hispanic or Latino Origin of Householder by Race of Householder
County
Block
Household Size by Household Type by Presence of Own Children
County
Block
Household Type by Age of Householder
County
Block
Households by Presence of People 60 Years and Over by Household Type
County
Block
Households by Presence of People 60 Years and Over, Household Size, and Household Type
County
Block
Households by Presence of People 75 Years and Over, Household Size, and Household Type
County
Block
Household Type by Household Size
County
Block
Household Type by Household Size by Race of Householder
County
Block
Relationship by Age for the Population Under 18 Years
County
Block
Household Type by Relationship for the Population 65 Years and Over
County
Block
Household Type by Relationship for the Population 65 Years and Over by Race
County
Block
Family Type by Presence and Age of Own Children
County
Block
Family Type by Presence and Age of Own Children by Race of Householder
County
Block
Age of Grandchildren Under 18 Years Living with A Grandparent Householder
County
Block
Household Type by Relationship by Race
County
Block
Average Household Size by Age
To be determined
Block
Household Type for the Population in Households
To be determined
Block
Household Type by Relationship for the Population Under 18 Years
To be determined
Block
Population in Families by Age
To be determined
Block
Average Family Size by Age
To be determined
Block
Family Type and Age for Own Children Under 18 Years
To be determined
Block
Total Population in Occupied Housing Units by Tenure
To be determined
Block
Average Household Size of Occupied Housing Units by Tenure
To be determined
Block
Sex by Age for the Population in Households
County
Tract
Sex by Age for the Population in Households by Race
County
Tract
Presence of Multigenerational Households
County
Tract
Presence of Multigenerational Households by Race of Householder
County
Tract
Coupled Households by Type
County
Tract
Nonfamily Households by Sex of Householder by Living Alone by Age of Householder
County
Tract
Group Quarters Population by Sex by Age by Group Quarters Type
State
Tract
Tables in 2010 Summary File 1 That Would Be Eliminated in 2020(Proposed)
Population in Households by Age by Race of Householder
Average Household Size by Age by Race of Householder
Households by Age of Householder by Household Type by Presence of Related Children
Households by Presence of Nonrelatives
Household Type by Relationship for the Population Under 18 Years by Race
Household Type for the Population Under 18 Years in Households (Excluding Householders, Spouses, and Unmarried Partners)
Families*
Families by Race of Householder*
Population in Families by Age by Race of Householder
Average Family Size by Age by Race of Householder
Family Type by Presence and Age of Related Children
Family Type by Presence and Age of Related Children by Race of Householder
Group Quarters Population by Major Group Quarters Type*
Population Substituted
Allocation of Population Items
Allocation of Race
Allocation of Hispanic or Latino Origin
Allocation of Sex
Allocation of Age
Allocation of Relationship
Allocation of Population Items for the Population in Group Quarters
American Indian and Alaska Native Alone with One Tribe Reported for Selected Tribes
American Indian and Alaska Native Alone with One or More Tribes Reported for Selected Tribes
American Indian and Alaska Native Alone or in Combination with One or More Other Races and with One or More Tribes Reported for Selected Tribes
American Indian and Alaska Native Alone or in Combination with One or More Other Races
Asian Alone with One Asian Category for Selected Groups
Asian Alone with One or More Asian Categories for Selected Groups
Asian Alone or in Combination with One or More Other Races, and with One or More Asian Categories for Selected Groups
Native Hawaiian and Other Pacific Islander Alone with One Native Hawaiian and Other Pacific Islander Category for Selected Groups
Native Hawaiian and Other Pacific Islander Alone with One or More Native Hawaiian and Other Pacific Islander Categories for Selected Groups
Native Hawaiian and Other Pacific Islander Alone or in Combination with One or More Races, and with One or More Native Hawaiian and Other Pacific Islander Categories for Selected Groups
Hispanic or Latino by Specific Origin
Sex by Single Year of Age by Race
Household Type by Number of Children Under 18 (Excluding Householders, Spouses, and Unmarried Partners)
Presence of Unmarried Partner of Householder by Household Type for the Population Under 18 Years in Households (Excluding Householders, Spouses, and Unmarried Partners)
Nonrelatives by Household Type
Nonrelatives by Household Type by Race
Group Quarters Population by Major Group Quarters Type by Race
Group Quarters Population by Sex by Major Group Quarters Type for the Population 18 Years and Over by Race
Total Races Tallied for Householders
Hispanic or Latino Origin of Householders by Total Races Tallied
Total Population in Occupied Housing Units by Tenure by Race of Householder
Average Household Size of Occupied Housing Units by Tenure
Average Household Size of Occupied Housing Units by Tenure by Race of Householder
Occupied Housing Units Substituted
Allocation of Vacancy Status
Allocation of Tenure
Tenure by Presence and Age of Related Children
* Counts for these tables are available in other proposed DHC tables. For example, the count of families is available in the Household Type table, which will be available at the block level in the 2020 DHC.
I’m serving as a co-editor for a special issue for the Journal of Maps entitled “Celebrating the Census“. The Journal of Maps is an open access, peer reviewed journal published by the Taylor & Francis Group. The journal is distinct in that all articles feature maps and spatial diagrams as the focal point for studying geographic phenomena from both a physical / environmental and social science perspective.
Here’s the official synopsis for this census-themed special issue:
We invite contributions to a special issue of the Journal of Maps focused upon the evolving character and cartographic opportunities offered by traditional census statistics and the impact of transitioning from these sources of population data at a range of spatial scales into a new era of big data assembly. In so doing, the special issue marks two important events taking place in the UK during 2021 in the history of British Censuses and seeks contributions that reflect the past transition of population data cartography through the digital era of the last 50 years and anticipates its transformation into the big data era of the foreseeable future.
While the issue marks the 100th anniversary of the UK census, submissions concerning census mapping from around the world are welcome and encouraged in these topic areas, including but not limited to:
Spatial and statistical consistency over time
People on the move
Mapping people through space and time
Mapping morbidity and mortality
Politics and population data
International comparison of demographic mapping
Before and after population mapping using censuses and administrative sources
Population data and mapping human-environmental interaction
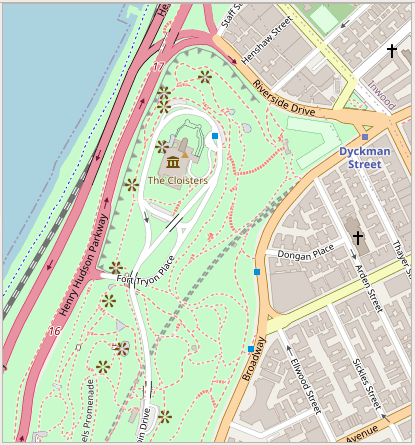
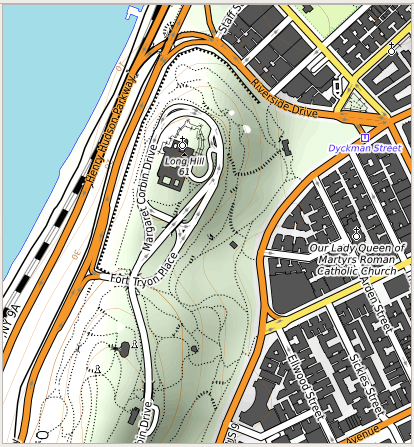
For this final post of 2020, I was looking back through recent projects for something interesting yet brief; I’ve been writing some encyclopedia-length posts lately and wanted to keep this one on the lighter side. In that vein, I’ve decided to share a short list of free web mapping services that I use as basemaps in QGIS (they’ll work in ArcGIS too). This has been on my mind as I’ve recently stumbled upon the OpenTopoMap, which is an alternate stylized version of the OpenStreetMap that looks pretty sharp.
Comparison of OpenStreetMap (left) and OpenTopoMap (right)
Select the appropriate web map service type in the browser panel (usually WMS / WMTS or XYZ Tiles), right click, and add new connection.
Give it a meaningful name, paste the appropriate URL into the URL box, click OK.
In the browser panel drill down to see the service, and for WMS / WMTS layers you can drill down further to see specific layers you can add.
Select the layer and drag it into the window, or select, right click, and add the layer to the project.
If the resolution looks off, right click on a blank area of the toolbar and check the Tile Scale Panel. Use this to adjust the zoom for the web map. If the scale bar is greyed out you’ll need to set the map window to the same CRS as the map service: select the layer in the panel, right click, and choose set CRS – set project CRS from layer.
Some web layers may render slowly if you’re zoomed out to the full extent, or even not at all if they contain many features or are super detailed. Conversely, some layers may not render if you’re zoomed too far in, as tiles may not be available at that resolution. Experiment!
If you’re an ArcGIS user see these concise instructions for adding various tile layers. This isn’t something that I’ve ever done, as ArcGIS already has a number of accessible basemaps that you can add.
In the list below, links for the service name take you to either the website version of the service, or to a list of additional layers that you can connect to. The URLs that follow are the actual connections to the service that you’ll use within your GIS package. If you use OSM, OTP, or Stamen in your maps, make sure to cite them (they use Creative Commons Licenses – follow links to their websites for details). The government sources are public domain, but you should still cite them anyway. Happy mapping, and happy holidays!
Current TIGER features:
https://tigerweb.geo.census.gov/arcgis/services/TIGERweb/tigerWMS_Current/MapServer/WMSServer

Current physical features:
https://tigerweb.geo.census.gov/arcgis/services/TIGERweb/tigerWMS_PhysicalFeatures/MapServer/WMSServer
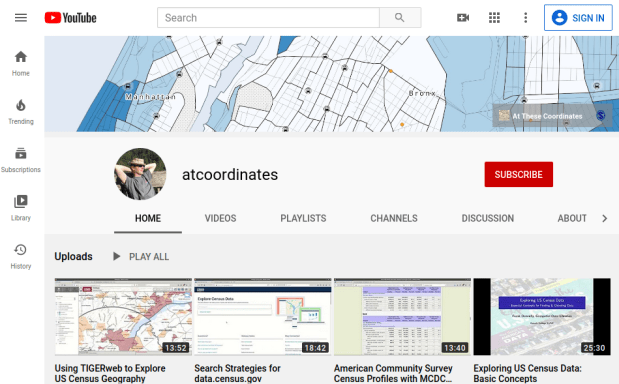
I have recently created an atcoordinates YouTube channel that features a series of how-to videos on finding and accessing US census data using a variety of websites and tools. I explain basic census concepts while demonstrating how to access data. At this point there are four videos:
Exploring US Census Data: Basic Concepts. This is a narrated slide show where I cover the essential choices you need to make and concepts you need to understand in order to access census data, regardless of the tool or platform: data set, time period, subjects or topics, and geography. I discuss the decennial census, American Community Survey, and population estimates. This video is intended as a prerequisite for viewing the others, so I don’t have to explain the same concepts each time and can focus on demonstrating each particular application.
American Community Survey Census Profiles with MCDC Apps. This screencast illustrates how you can quickly and easily access census profiles for any place in the US using the Missouri Census Data Center’s profile applications. It’s also a good introduction to census data in general, if you’re unfamiliar with the scope of data that’s available.
Search Strategies for data.census.gov. I demonstrate how to use the Census Bureau’s primary application for accessing current census data, using the advanced search tool and filters.
Using TIGERweb to Explore US Census Geography. I show you how to use this web map application for viewing census geography, while explaining what some of the small-area census geographies are.
I plan on adding additional videos every month or so. The pandemic lock down and uncertainty over whether classes will be back in session this fall inspired me to do this. While I prefer written tutorials, I find that I’ve been watching YouTube more often for learning how to do certain tasks with particular software, so I thought this would be useful for others. The videos average about 10 to 15 minutes in length, although the introductory one is a bit longer. The length is intentional; I wanted to explain the concepts and describe why you’re making certain choices, instead of simply pointing and clicking without any explanation.
Feel free to spread the news, share and embed the videos in research guides or web pages, and use them in classes or workshops. Of course, for a more in-depth look at US census data, check out my book: Exploring the US Census: Your Guide to America’s Datapublished by SAGE.


You must be logged in to post a comment.