Here’s a fun post to close out the year. During GIS-based research consultations, I often help people understand the importance of coordinate reference systems (or spatial reference systems if you prefer, aka “map projections”). These systems essentially make GIS “work”; they are standards that allow you to overlay different spatial layers. You transform layers from one system to another in order to get them to align, perform specific operations that require a specific system, or preserve one aspect of the earth’s properties for a certain analysis you’re conducting or a map you’re making.
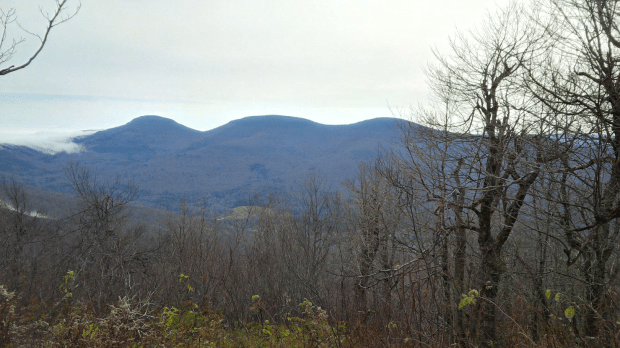
Wrestling with these systems is a conceptual issue that plays out when dealing with digital data, but I recently stumbled across a physical manifestation purely by accident. During the last week of October my wife and I rented a tiny home up in the Catskill Mountains in NY State, and decided to go for a day hike. The Catskills are home to 35 mountains known collectively as the Catskill High Peaks, which all exceed 3,500 feet in elevation. After consulting a thorough blog on upstate walks and hikes (Walking Man 24 7), we decided to try Windham High Peak, which was the closest mountain to where we were staying. We were rewarded with this nice view upon reaching the summit:
While poking around on the peak, we discovered a geodetic survey marker from 1942 affixed to the face of a rock. These markers were used to identify important topographical features, and to serve as control points in manual surveying to measure elevation; this particular marker (first pic below) is a triangulation marker that was used for that purpose. It looks like a flat, round disk, but it’s actually more like the head of a large nail that’s been driven into the rock. A short distance away was a second marker (second pic below) with a little arrow pointing toward the triangulation marker. This is a reference marker, which points to the other marker to help people locate it, as dirt or shrubbery can obscure the markers over time. Traditional survey methods that utilized this marker system were used for creating the first detailed sets of topographic maps and for establishing what the elevations and contours were for most of the United States. There’s a short summary of the history of the marker’s here, and a more detailed one here. NOAA provides several resources for exploring the history of the national geodetic system.
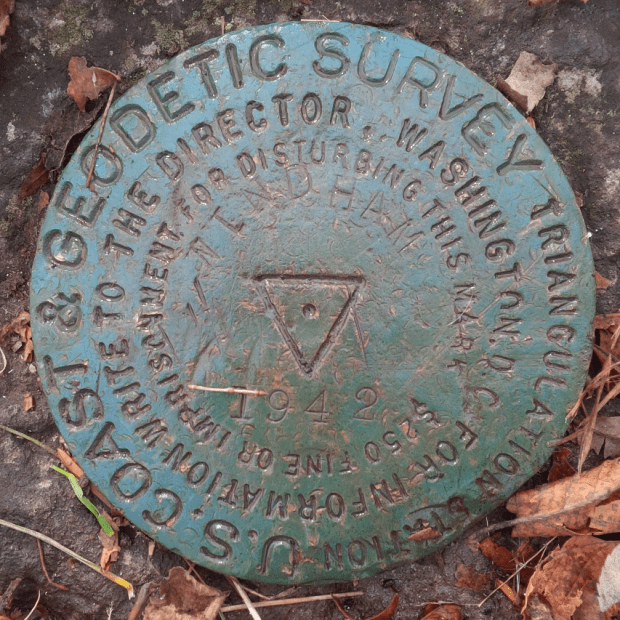
Triangulation Survey Marker
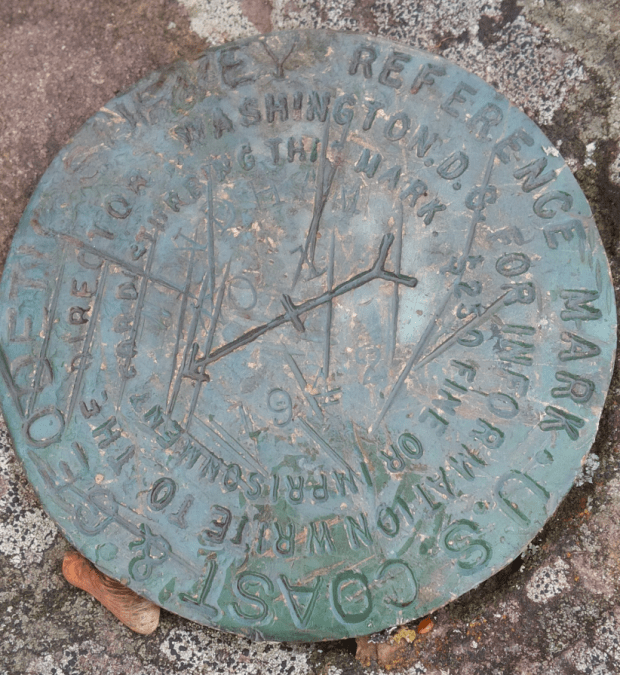
Reference Survey Marker
When we returned home I searched around to learn more about them, and discovered that NOAA has an app that allows you to explore all the markers throughout the US, and retrieve information about them. Each data sheet provides the longitude and latitude coordinates for the marker in the most recent reference system (NAD 83), plus previous systems that were originally used (NAD 27), a detailed physical description of the location (like the one below), and a list of related markers. It turns out there were two reference markers on the peak that point to the topographic one (we only found the first one). The sheet also references a distant point off of the peak that was used for surveying the height (the azimuth mark). There’s even a recovery form for submitting updated information and photographs for any markers you discover.
NA2038’DESCRIBED BY COAST AND GEODETIC SURVEY 1942 (GWL)
NA2038’STATION IS ON THE HIGHEST POINT AND AT THE E END OF A MOUNTAIN KNOWN
NA2038’AS WINDHAM HIGH PEAK. ABOUT 4 MILES, AIR LINE, ENE OF HENSONVILLE
NA2038’AND ON PROPERTY OWNED BY NEW YORK STATE. MARK, STAMPED WINDHAM
NA2038’1942, IS SET FLUSH IN THE TOP OF A LARGE BOULDER PROTRUDING
NA2038’ABOUT 1 FOOT, 19 FEET SE OF A LONE 10-INCH PINE TREE. U.S.
NA2038’GEOLOGICAL SURVEY STATION WINDHAM HIGH PEAK, A DRILL HOLE IN A
NA2038’BOULDER, LOCATED ON THIS SAME MOUNTAIN WAS NOT RECOVERED.
For the past thirty plus years or so we’ve used satellites to measure elevation and topography. I used my new GPS unit on this hike; I still chose a simple, bare-bones model (a Garmin eTrex 10), but it was still an upgrade as it uses a USB connection instead of a clunky serial port. The default CRS is WGS 84, but you can change it to NAD 83 or another geographic system that’s appropriate for your area. By turning on the tracking feature you can record your entire route as a line file. Along the way you can save specific points as way points, which records the time and elevation.
Moving the data from the GPS unit to my laptop was a simple matter of plugging it into the USB port and using my operating system’s file navigator to drag and drop the files. One file contained the tracks and the other the way points, stored in a Garmin format called a gpx file (a text-based XML format). While QGIS has a number of tools for working with GPS data, I didn’t need to use any of them. QGIS 3.4 allows you to add gpx files as vector files. Once they’re plotted you can save them as shapefiles or geopackages, and in the course of doing so reproject them to a projected coordinate system that uses meters or feet. I used the field calculator to add a new elevation column to the way points to calculate elevation in feet (as the GPS recorded units in meters), and to modify the track file to delete a line; apparently I turned the unit on back at our house and the first line connected that point to the first point of our hike. By entering an editing mode and using the digitizing tool, I was able to split the features, delete the segments that weren’t part of the hike, and merge the remaining segments back together.
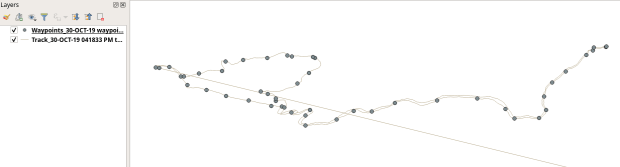
Original way points and track plotted in QGIS, with erroneous line
Using methods I described in an earlier post, I added a USGS topo map as a WMTS layer for background and modified the symbology of the points to display elevation labels, and voila! We can see all eight miles of our hike as we ascended from a base of 1,791 to a height of 3,542 feet (covering 1,751 feet from min to max). We got some solid exercise, were rewarded with some great views, and experienced a mix of old and new cartography. Happy New Year – I hope you have some fun adventures in the year to come!
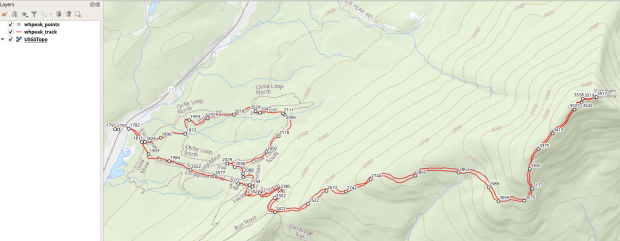
Stylized way points with elevation labels and track displayed on top of USGS topo map in QGIS

You must be logged in to post a comment.