Right before the semester began, I updated the Rhode Island maps on my census research guide so that they link to the recently released Demographic Profile tables from the 2020 Census. I feel like the release of the 2020 census has flown lower on the radar compared to 2010 – it hasn’t made it into the news or social media feeds to the same degree. It has been released much later than usual for a variety of reasons, including the COVID pandemic and political upheaval and shenanigans. At this point in Sept 2023, most of what we can expect has been released, and is available via data.census.gov and the census APIs.
Here are the different series, and what they include.
- Apportionment data. Released in Apr 2021. Just the total population counts for each state, used to reapportion seats in Congress.
- Redistricting data. Released in Aug 2021. Also known as PL 91-171 (for the law that requires it), this data is intended for redrawing congressional and legislative districts. It includes just six tables, available for several geographies down to the block level. This was our first detailed glimpse of the count. The dataset contains population counts by race, Hispanic and Latino ethnicity, the 18 and over population, group quarters, and housing unit occupancy. Here are the six US-level tables.
- Demographic and Housing Characteristics File. Released in May 2023. In the past, this series was called Summary File 1. It is the “primary” decennial census dataset that most people will use, and contains the full range of summary data tables for the 2020 census for practically all census geographies. There are fewer tables overall relative to the 2010 census, and fewer that provide a geographically granular level of detail (ostensibly due to privacy and cost concerns). The Data Table Guide is an Excel spreadsheet that lists every table and the variables they include.
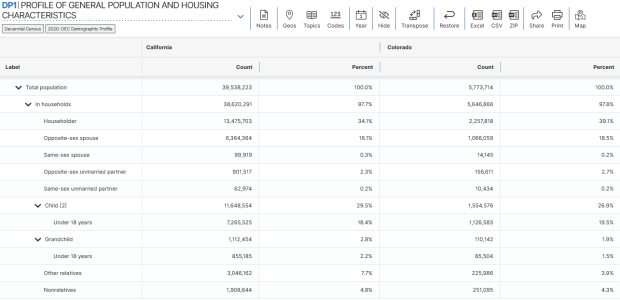
- Demographic Profile. Released in May 2023. This is a single table, DP1, that provides a broad cross-section of the variables included in the 2020 census. If you want a summary overview, this is the table you’ll consult. It’s an easily accessible option for folks who don’t want or need to compile data from several tables in the DHC. Here is the state-level table for all 50 states plus.
- Detailed Demographic and Housing Characteristics File A. Released in Sept 2023. In the past, this series was called Summary File 2. It is a subset of the data collected in the DHC that includes more detailed cross-tabulations for race and ethnicity categories, down to the census tract level. It is primarily used by researchers who are specifically studying race, and the multiracial population.
- Detailed Demographic and Housing Characteristics File B. Not released yet. This will be a subset of the data collected in the DHC that includes more detailed cross-tabulations on household relationships and tenure, down to the census tract level. Primarily of interest to researchers studying these characteristics.
There are a few aspects of the 2020 census data that vary from the past – I’ll link to some NPR stories that provide a good overview. Respondents were able to identify their race or ethnicity at a more granular level. In addition to checking the standard OMB race category boxes, respondents could write in additional details, which the Census Bureau standardized against a list of races, ethnicities, and national origins. This is particularly noteworthy for the Black and White populations, for whom this had not been an option in the recent past. It’s now easier to identify subgroups within these groups, such as Africans and Afro-Caribbeans within the Black population, and Middle Eastern and North Africans (MENA) within the White population. Another major change is that same-sex marriages and partnerships are now explicitly tabulated. In the past, same-sex marriages were all counted as unmarried partners, and instead of having clearly identifiable variables for same-sex partners, researchers had to impute this population from other variables.
Another major change was the implementation of the differential privacy mechanism, which is a complex statistical process to inject noise into the summary data to prevent someone from reverse engineering it to reveal information about individual people (in violation of laws to protect census respondent’s privacy). The social science community has been critical of the application of this procedure, and IPUMS has published research to study possible impacts. One big takeaway is that published block-level population data is less reliable than in the past (housing unit data on the other hand is not impacted, as it is not subjected to the mechanism).
When would you use decennial census data versus other census data? A few considerations – when you:
- Want or need to work with actual counts rather than estimates
- Only need basic demographic and housing characteristics
- Need data that provides detailed cross-tabulations of race, which is not available elsewhere
- Need a detailed breakdown of the group quarters population, which is not available elsewhere
- Are explicitly working with voting and redistricting
- Are making historical comparisons relative to previous 10-year censuses
In contrast, if you’re looking for detailed socio-economic characteristics of the population, you would need to look elsewhere as the decennial census does not collect this information. The annual American Community Survey or monthly Current Population Survey would be likely alternatives. If you need basic, annual population estimates or are studying the components of population change, the Population and Housing Unit Estimates Program is your best bet.
