
In this post I’ll share a process for getting geo-located tweets from Twitter, using large files of tweets archived by the Internet Archive. These are tweets where the user opted to have their phone or device record the longitude and latitude coordinates for their location, at the time of the tweet. I’ve created some straightforward scripts in Python without any 3rd party modules for processing a daily file of tweets. Given all the turmoil at Twitter in early 2023, most of the tried and true solutions for scraping tweets or using their APIs no longer function. What I’m presenting here is one, simple solution.
Social media data is not my forte, as I specialize in working with official government datasets. When such questions turn up from students, I’ve always turned to the great Web Scraping Toolkit developed by our library’s Center for Digital Scholarship. But the graduate student I was helping last week and I discovered that both the Twint and TAGS tools no longer function due to changes in Twitter’s developer policies. Surely there must be another solution – there are millions of posts on the internet that show how easy it is to grab tweets via R or Python! Alas, we tried several alternatives to no avail. Many of these projects rely on third party modules that are deprecated or dodgy (or both), and even if you can escape from dependency hell and get everything working, the changed policies rendered them moot.
You can register under Twitter’s new API policy and get access to a paltry number of records. But I thought – surely, someone else has scraped tons of tweets for academic research purposes and has archived them somewhere – could we just access those? Indeed, the folks at Harvard have. They have an archive of geolocated tweets in their dataverse repository, and another one for political tweets. They are also affiliated with a much larger project called DocNow with other schools that have different tweet archives. But alas, there are rules to follow, and to comply with Twitter’s license agreement Harvard and these institutions can’t directly share the raw tweets with anyone outside their institutions. You can search and get IDs to the tweets, using their Hydrator application, which you can use in turn to get the actual tweets. But then in small print:
“Twitter’s changes to their API which greatly reduce the amount of read-only access means that the Hydrator is no longer a useful application. The application keys, which functioned for the last 7 years, have been rescinded by Twitter.”
Fortunately, there is the Internet Archive, which has been working to preserve pieces of the internet for posterity for several decades. Their Twitter Stream Grab consists of monthly collections of daily files for the past few years, from 2016 to 2022. This project is no longer active, but there’s a newer one called the Twitter Archiving Project which has data from 2017 to now. I didn’t investigate this latter one, because I wasn’t sure if it provided the actual tweets or just metadata about them, while the older project definitely did. The IA describes the Stream Grab as the “spritzer” version of Twitter grabs (as opposed to a sprinkler or garden hose). Thanks to the internet, it’s easy to find statistics but hard to find reliable ones – this one, credible looking source (the GDELT Project) suggests that there are between 400 and 500 million tweets a day in recent years. The file I downloaded from IA for one day had over 4 million tweets, so that’s about 1% of all tweets.
I went into the November 2022 collection and downloaded the file for Nov 1st. It’s a TAR file that’s about 3 GB. Unzipping it gives you a folder for that data named for the date, with hundreds of gz ZIP files. Unzip those, and you have tons of JSON Line files. These are JSON files where each JSON record has been collapsed into one line.
Python to the rescue. See GitHub for the full scripts – I’ll just add some snippets here for illustration. I wrote two scripts: the first reads in and aggregates all the tweets from the JSONL files, parses them into a Python dictionary, and writes out the geo-located records into regular JSON. The second reads in that file, selects the elements and values that we want into a list format, and writes those out to a CSV. The rationale was to separate importing and parsing from making these selections, as we’re not going to want to repeat the time-consuming first part while we’re tweaking and modifying the second part.
In the sample data I used for 11/01/2022, unzipping the downloaded TAR file gave me a date folder, and in that date folder were hundreds of gz ZIP files. Unzipping those revealed the JSONL files. I wrote the script to look in that date folder, one level below the folder that holds the scripts, and read in anything that ended with .json. Not all of the Internet Archive’s stream’s are structured this way; if your downloads are structured differently, you can simply move all the unzipped json files to one directory below the script to read them. Or, you can modify the script to iterate through sub-directories.
Because the data was stored as JSONL, I wasn’t able to read it in as regular JSON. I read each line as a string that I appended to a list, iterated through that list to convert it into a dictionary, pulled out the records that had geo-located elements, and added those records to a larger dictionary where I used an identifier in the record as a key and the value as a dictionary with all elements and values for a tweet. This gets written out as regular JSON at the end. Reading the data in didn’t take long; parsing the strings into dictionaries was the time consuming part. Originally, I wanted to parse and save all 4 million records, but the process stalled around 750k as I ran out of memory. Since so few records are geo-located, just selecting these circumvented this problem. If you wanted to modify this part to get other kinds of records, you would need to apply some filter, or implement a more efficient process than what I’m using.
json_list=[] # list of lists, each sublist has 1 string element = 1 line

for f in os.listdir(json_dir):
    if f.endswith('.json'):
        json_file=os.path.join(json_dir,f)
        with open(json_file,'r',encoding='utf-8') as jf:
            jfile_list = list(jf) # create list with one element, a line saved as a string
            json_list.extend(jfile_list)
            print('Processed file',f,'...')

geo_dict={} # dictionary of dicts, each dict has line parsed into keys / values
i=0
for json_str in json_list:
    result = json.loads(json_str) # convert line / string to dict
    if result.get('geo')!=None: # only take records that were geocoded
        geo_dict[result['id']]=result
    i=i+1
    if i%100000==0:
        print('Processed',i,'records...')
The second script reads the JSON output from the first, and simply iterates through the dictionary and chooses the elements and values I want and assigns them to variables. Some of these are straightforward, such as grabbing the timestamp and tweet. Others required additional work. The source element provides HTML code with a source link and name, so I split and strip this value to get them separately. The coordinates are stored as a list, so to get longitude and latitude as separate values I indicate the list position. In cases where I’m delving into a sub-dictionary to get a value (like the coordinates), I added if statements to set values to None if they don’t exist in the JSON, otherwise you get an error. Once I finish iterating, I append all these variables to a list, and add this list to the main one that captures every record. I create a matching header row list, and both are written out as a CSV.
with open(input_json) as json_file:
    twit_data = json.load(json_file)

twit_list=[]

# In this block, select just the keys / values to save
for k,v in twit_data.items():
    tweet_id=k
    timestamp=v.get('created_at')
    tweet=v.get('text')
    # Source is in HTML with anchors. Separate the link and source name
    source=v.get('source') # This is in HTML
    source_url=source.split('"')[1] # This gets the url
    source_name=source.strip('</a>').split('>')[-1] # This gets the name
    lang=v.get('lang')
    # Value for long / lat is stored in a list, must specify position
    if v['geo'] !=None:
        longitude=v.get('geo').get('coordinates')[1]
        latitude=v.get('geo').get('coordinates')[0]
    else:
        longitude=None
        latitude=None
...
My code could use improvement – much of this could be abstracted into a function to avoid repetition. We were in a hurry, and I’m also working with folks who need data but aren’t necessarily familiar with Python, so something that’s inefficient but understandable is okay (although I will polish this up in the future).
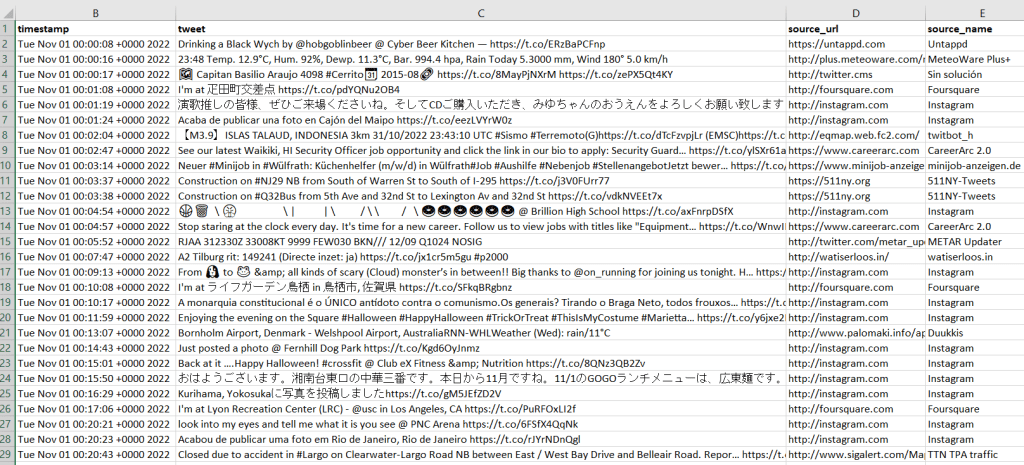
I provide the output in GitHub, examples of the final CSV appear below. Every language in the world is captured in these tweets, so Windows users need to import the CSV into Excel (Data – From Text/CSV) and choose UTF-8 encoding. Double-clicking the CSV to open it in Excel in Windows will render most of the text as junk, in the default Windows-1252 encoding.

So, is this data actually useful? That’s an open question. Of the 4 million tweets in this file, just over 1,158 were geo-located! I checked and this is not a mistake. The metadata record for the Harvard geolocated tweets mentions that only 1% to 2% of all tweets are geo-located. So of the 400 million daily tweets, only 4 million. And out of our daily 4 million sample from IA, just 1,158 (less than 1%). What we ended up with does give you a sense of variety and global coverage (see map at the top of the post, showing sample of tweets by language Nov 1, 2022). In this sample, the top five countries represented were: US (35%), Japan (17%), Brazil (4%), UK (4%), Mexico and Turkey (tied 3%). For languages, the top five: English (51%), Japanese (17%), Spanish (9%), Portuguese (5%), and Turkish (3%).
In many cases, I think you’d need a larger sample than a single day, assuming you’re interested in just geo-located records. Perhaps 4 million is large enough for certain non-spatial research? Again, not my area of expertise, but you would want to be aware of events that happened on a certain date that would influence what was tweeted. My graduate student wanted to see differences in certain kinds of tweets in the LA metro area versus the rest of the US, but this sample includes less than 20 tweets from LA. To do anything meaningful, she’d have to download and process a whole month of tweets (at least). Even then, there are certain tweeters that show up repeatedly in given areas. In NYC, most of the tweets on this date were from the 511 service, warning people where that day’s potholes were.
Beyond the location of the tweet, there is a lot of information about the user, including their self-reported location. This data is available in all tweets (not just the geo-located ones). But there are a lot problems with this attribute: the user isn’t necessarily tweeting from that location, as it represents their “static” home. This location is not geocoded, and it’s self reported and uncontrolled. In this example, some users dutifully reported their home as ‘Cleveland, OH’ or ‘New York City’. Other folks listed ‘NYC – LA – ATL – MIA’, ‘CIUDAD DE LAS BAJAS PASIONES’, ‘H E L L’, and ‘Earth. For now’.
Even for research that incorporated geo-located tweets from other, larger data sources that were previously accessible, how representative are all those studies when the data represents only 1% of the total tweet volume? I am skeptical. Also consider the information from the good folks at the Pew Research Center, that tells us that only one in five US adults use Twitter, and that the minority of Twitter users generate the vast majority of tweets: “The top 25% of US users by tweet volume produce 97% of all tweets, while the bottom 75% of users produce just 3%” (10 Facts About Americans and Twitter May 5, 2022).
For what’s it worth, if you need access to Twitter data for academic, non-commercial research purposes and the old methods aren’t working, perhaps the Internet Archive’s data and the solution posed here will fit the bill. You can see the geo-located output (JSON and CSV) from this example in the GitHub repo’s output folder. There is also a samples folder, which contains JSON and CSV for about 77k records that include both geo-located and non-geolocated examples. Looking at the examples can help you decide how to modify the scripts, to pull out different elements and values of interest.

You must be logged in to post a comment.