HIFLD Open, a key repository for accessing US GIS datasets on infrastructure, is shutting down on August 26, 2025. This is a revision from a previous announcement, which said that it would be live until at least Sept 30. The portal provided national layers for schools, power lines, flood plains, and more from one convenient location. DHS provides no sensible explanation for dismantling it, other than saying that hosting the site is no longer a priority for their mission (here’s a copy of an official announcement). In other words, “Public domain data for community preparedness, resiliency, research, and more” is no longer a DHS priority.
The 300 plus datasets in Open HIFLD are largely created and hosted by other agencies, and Open HIFLD was aggregating different feeds into one portal. So, much of the data will still be accessible from the original sources. It will just be harder to find.
DHS has published a crosswalk with links to alternative portals and the source feeds for each dataset, so you can access most of the data once Open HIFLD goes offline. I’ve saved a copy here, in case it also disappears. Most of these sources use ESRI REST APIs. Using ArcGIS Online or Pro, and even QGIS (for example), you can connect to these feeds, get a listing in your contents pane, and drag and drop layers into a project (many of the layers are also available via ArcGIS Online or the Living Atlas if you’re using Arc). Once you’ve added a layer to a project, you can export and save local copies.
Adding ArcGIS Rest Server for US Army Corps of Engineers Data in QGIS
If you want to download copies directly from Open HIFLD before it vanishes on Aug 26, I’ve created this spreadsheet with direct links to download pages, and to metadata records when available (some datasets don’t have metadata, and the links will bring you to an empty placeholder). Some datasets have multiple layers, and you’ll need to click on each one in a list to get to it’s download page. In some cases there won’t be a direct download link, and you’ll need to go to the source (a useful exercise, as you’ll need to remember where it is in the future). Alternatively, you can connect to the REST server (before Aug 26, 2025) in QGIS or ArcGIS, drag and drop the layers you want, and then export:
I’m coordinating with the Data Rescue Project, and we’re working on downloading copies of everything on Open HIFLD and hosting it elsewhere. I’ll provide an update once this work is complete. Even though most of these datasets will still be available from the original sources, better safe than sorry. There’s no telling what could disappear tomorrow.
The secure HIFLD site for registered users will remain available, but many of the open layers aren’t being migrated there (see the crosswalk for details). The secure site is available to DHS partners, and there are restrictions on who can get an account. It’s not exactly clear what they are, but it seems unlikely that most Open users will be eligible: “These instructions [for accessing a secure account] are for non-DHS users who support a homeland security or homeland defense mission AND whose role requires access to the Geospatial Information Infrastructure (GII) and/or any geospatial dashboards, data, or tools housed on the GII…“
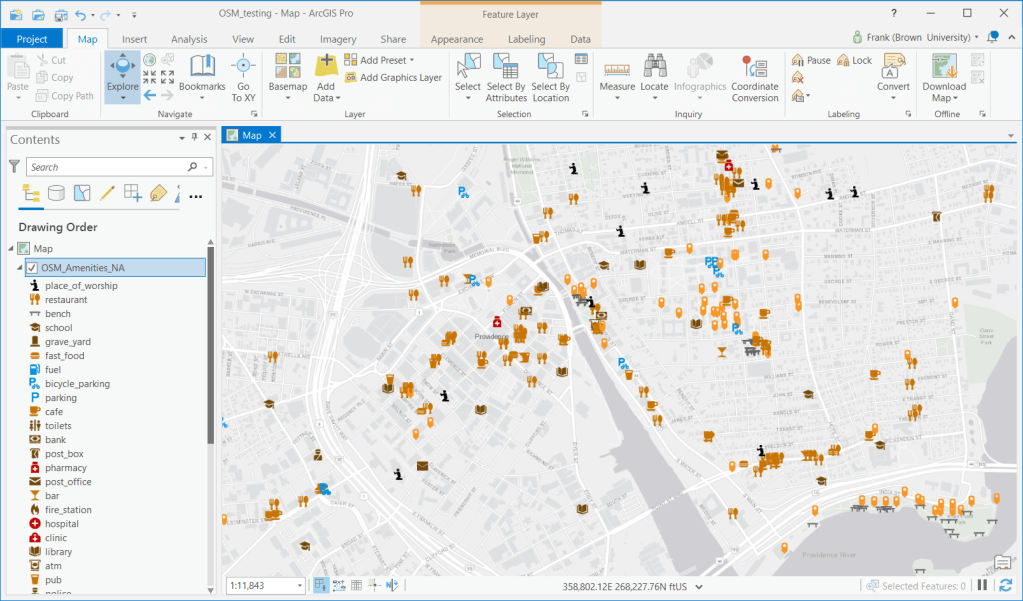
A couple years ago I wrote a post that demonstrated how to use the QuickOSM plugin for QGIS to easily extract features from the OpenStreetMap (OSM). The OSM is a great source for free and open GIS data, especially for types of features that are not captured in government sources, and for parts of the world that don’t possess a free or robust GIS data infrastructure. I’ve been using ArcGIS Pro more extensively in my new job and was wondering how I could do the same thing: query features from the OSM based on keys and values (denoting feature type) and geographic area and extract them as a vector layer. I’m looking for straightforward solutions that I could use for answering questions from students (so no command line tricks or database stuff). In this post I’ll cover three approaches for achieving this in ArcGIS Pro, with references to QGIS.
File Approach
The most straightforward method would be to export data directly from the main OSM page by zooming into an area and hitting the Export button. This is a pretty blunt approach, as you have to be zoomed in pretty close and you grab every possible feature in the view. The “native” file format of OSM is the osm / pbf format; .osm is an XML file while .pbf is a compressed binary version of the osm. QGIS is able to handle these files directly; you just add them as a vector layer. ArcGIS Pro cannot. You have to download and install a special Data Interoperability extension, which is an esoteric thing that’s not part of the standard package and requires a special license from your site license coordinator.
A better and more targeted approach is to download pre-created extracts that are provided by a number of organizations listed in the OSM wiki. I started with Geofabrik in Germany, as it was a source I recognized. They package OSM data by geographic area and feature type. On their main page they list files that contain all features for each of the continents. These are enormous files, and as such they are only provided in the osm pbf format as shapefiles can’t effectively handle data that size. Even if you downloaded the osm pbf files and added them to QGIS, the software will struggle to render something that big.
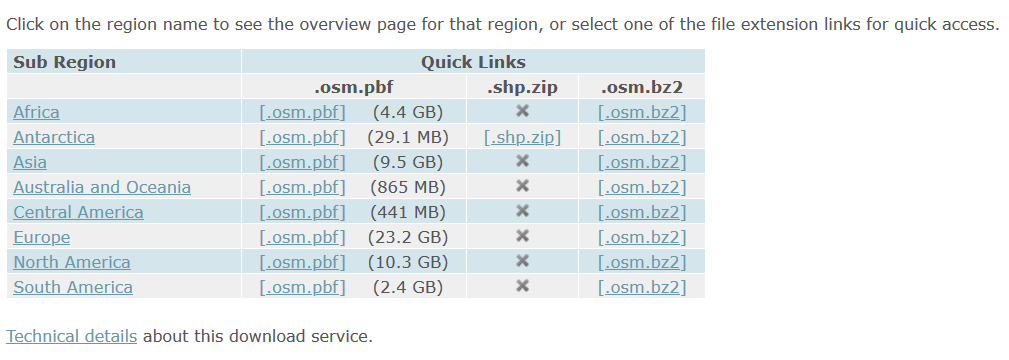
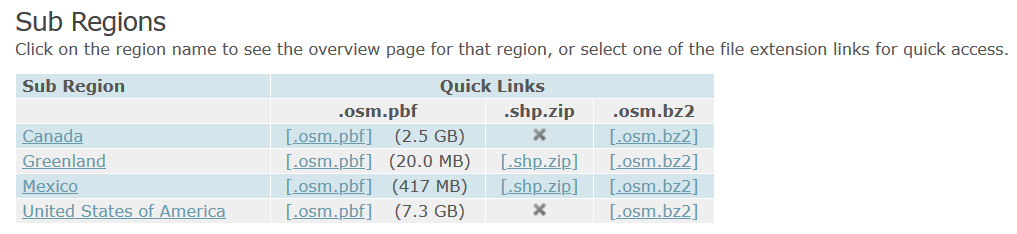
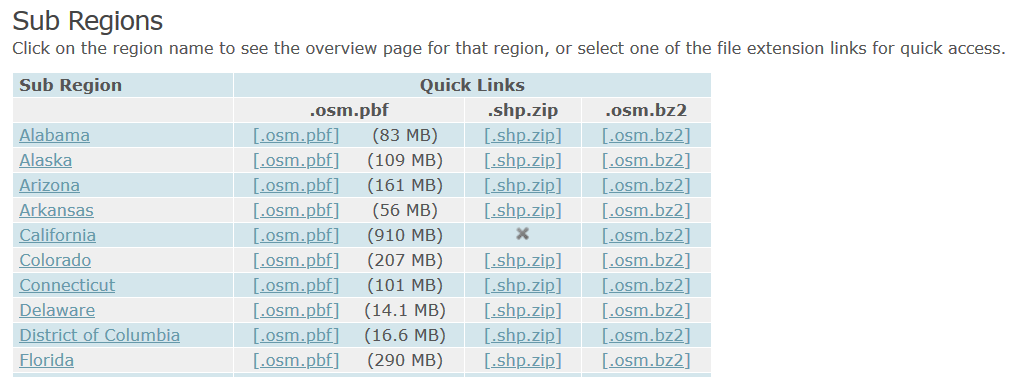
But all is not lost; Geofabrik and many other providers package data in a shapefile format for smaller areas, provided that the size and number of features is not too great. For instance, on Geofabrik’s download page if you click on North America you’re presented with country extracts for that continent (see images below). You can get shapefiles for Greenland and Mexico, but not Canada or the US as the files are still too big. Click on US, and you’re presented with files for each of the states. No luck for California (too big), but the rest of states are small enough that you can get shapefiles for all of them.
Default Geofrabrik OSM download page for continents. Click on a continent name…
…to access files for countries. Click on a country name…
…to access files for states / provinces / admin divisions
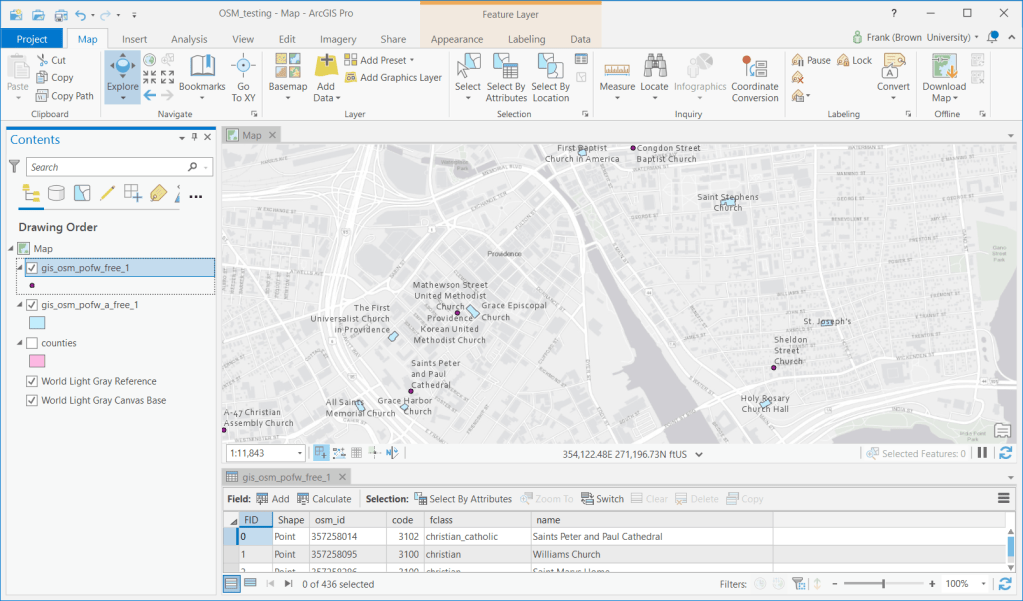
I downloaded and unzipped the file for Rhode Island. It contains a number of individual shapefiles classified by type of feature: buildings, land use, natural, places, places of worship (pofw), points of interest (pois), railways, roads, traffic, transport, water, and waterways. Many of the files appear twice: files with an “a” suffix represent polygons (areas) while files without that suffix are points or lines. Some OSM features are stored as polygons when such detail is available, while others are represented as points.
For example, if I add the two places of workship files to a map, for some features you have the outline of the actual building, while for most you simply have a point. After adding the layers to the map, you’ll probably want to use Select by Attribute to select the features you want based on OSM tags with keys and values, and Select by Location in conjunction with a separate boundary file to pull data out for a smaller area. The Geofabrik OSM attribute table is limited to basic attributes: an OSM ID, feature code and class, and name. It’s also likely that you’ll want to unify the point and polygon features of the same type into one layer, as they’re usually mutually exclusive. Use the Centroid (Polygon) tool in the toolbox to turn the polygons into points, and the Merge tool to meld the two point layers together. In QGIS the comparable tools under the Vector menu are Centroids and Merge Vector Layers. WGS 84 is the default CRS for the layers.
OSM Places of Worship. Some features are stored as points while others are polygons
Geofabrik is just one option. There are several others and they take different approaches for structuring their extracts. For example, BBBike.org organizes their layers by city for over 200 cities around the world, and they provide a number of additional formats beyond OSM PBF and shapefiles, such as Garmin GPS, GeoJSON, and CSV. They divide the data into fewer files, and if they don’t compile data for the area you’re interested in you can use a web-based tool to create a custom extract.
Plugin Approach
It would be nice to use a plugin, as that would allow you to specify a custom geographic area and retrieve just the specific features you want. QuickOSM works quite nicely for QGIS. Fortunately there is a good ArcGIS Pro solution called OSMquery. It works for both Pro and Desktop, tested for Pro 2.2 and Desktop 10.6. I’m using Pro 2.7 and the basic tool worked fine. It’s well documented, with good instructions for installation and use.
The plugin is written in Python and you add it as a tool to your ArcToolbox. Download the repo from the OSMquery GitHub as a ZIP file (click the green code button and choose Download ZIP). Save it in or near your ArcGIS project folders, and unzip it. In Pro, go into a project and open a Catalog Pane in the View ribbon. Right click on Toolbox to add a new one, and browse to the folder you unzipped to add the tool. There are two scripts in the box, a basic and an advanced version. The basic tool functioned without trouble for me. The advanced tool threw an error, probably some Python dependency issue (I didn’t investigate as the basic tool met my needs).
In the basic tool you choose the key and value for the features you want to extract; the dropdown menu is automatically populated with these options. For the geographic extent you can enter a place name, or you can use the extent of the current map window or of a layer in the project, or you can manually type in bounding box coordinates. Another nice option is you can transform the CRS of the extracted features from WGS 84 to another system, so it matches the CRS of layers in your existing project. Run the tool, and the features are extracted. If the features exist as both points and polygons, you get two separate files for each. If you choose, you can merge them together as described in the previous section; this is a bit tougher as the plugin approach yields a much wider selection of fields in the attribute table, and not all of the point and polygon attributes align. With the Merge tool in Pro you can select which attributes you want to hold on to, and common ones will be merged. QGIS is a bit messier in this regard, but in my earlier post I outlined a work-around using a spatial database.
The basic OSMquery tool in an ArcGIS Pro toolbox
Web Feature Service
This initially seemed to be the most promising route, but it turned out to be a dud. Like QGIS, Pro allows you to add OSM as a tiled base map. But ESRI also offers OSM as a web feature service: by hitting Add Data on the Map ribbon and searching the Living Atlas for “OpenStreetMap” you can select from a number of OSM web feature services, organized by continent and feature type. Once you add them to a map, you can select and click on individual features to see their name and feature type. The big problem is that you are not allowed to extract features from these layers, which leaves you with an enormous and heterogeneous mix of features for an entire continent. You can interact with the features, selecting by attribute and location in reference to other spatial layers, but that’s about it.
OSM web feature service in ArcGIS Pro
In Summary
I would recommend taking the step of downloading the OSMquery plugin for ArcGIS Pro if you want to take a highly targeted approach to OSM feature extraction (for QGIS users, enable the QuickOSM plugin). This approach is also best if you can’t download a pre-existing extract for your area because it’s too large or has too many features, and if you want to access the fullest possible range of attribute values. Otherwise, you can simply download one of the pre-created extracts, and use your software to winnow it down to what you need (or if you do need everything, the file approach makes more sense). Since the file-based option includes fewer attributes, converting polygon features to points and merging them with the other point features is a bit simpler.
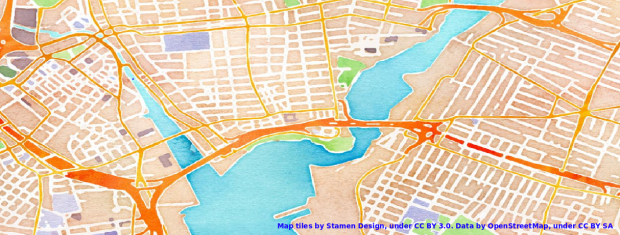
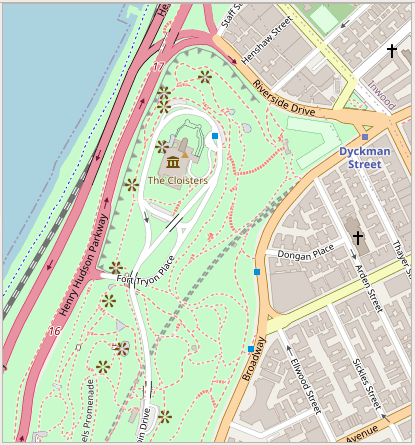
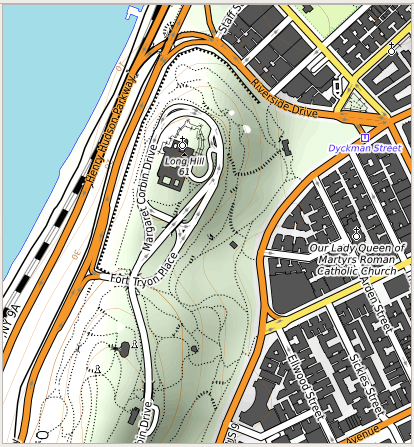
For this final post of 2020, I was looking back through recent projects for something interesting yet brief; I’ve been writing some encyclopedia-length posts lately and wanted to keep this one on the lighter side. In that vein, I’ve decided to share a short list of free web mapping services that I use as basemaps in QGIS (they’ll work in ArcGIS too). This has been on my mind as I’ve recently stumbled upon the OpenTopoMap, which is an alternate stylized version of the OpenStreetMap that looks pretty sharp.
Comparison of OpenStreetMap (left) and OpenTopoMap (right)
Select the appropriate web map service type in the browser panel (usually WMS / WMTS or XYZ Tiles), right click, and add new connection.
Give it a meaningful name, paste the appropriate URL into the URL box, click OK.
In the browser panel drill down to see the service, and for WMS / WMTS layers you can drill down further to see specific layers you can add.
Select the layer and drag it into the window, or select, right click, and add the layer to the project.
If the resolution looks off, right click on a blank area of the toolbar and check the Tile Scale Panel. Use this to adjust the zoom for the web map. If the scale bar is greyed out you’ll need to set the map window to the same CRS as the map service: select the layer in the panel, right click, and choose set CRS – set project CRS from layer.
Some web layers may render slowly if you’re zoomed out to the full extent, or even not at all if they contain many features or are super detailed. Conversely, some layers may not render if you’re zoomed too far in, as tiles may not be available at that resolution. Experiment!
If you’re an ArcGIS user see these concise instructions for adding various tile layers. This isn’t something that I’ve ever done, as ArcGIS already has a number of accessible basemaps that you can add.
In the list below, links for the service name take you to either the website version of the service, or to a list of additional layers that you can connect to. The URLs that follow are the actual connections to the service that you’ll use within your GIS package. If you use OSM, OTP, or Stamen in your maps, make sure to cite them (they use Creative Commons Licenses – follow links to their websites for details). The government sources are public domain, but you should still cite them anyway. Happy mapping, and happy holidays!
Current TIGER features:
https://tigerweb.geo.census.gov/arcgis/services/TIGERweb/tigerWMS_Current/MapServer/WMSServer

Current physical features:
https://tigerweb.geo.census.gov/arcgis/services/TIGERweb/tigerWMS_PhysicalFeatures/MapServer/WMSServer
I did a lot of hiking around Sedona, Arizona a few weeks ago, and wanted to map my GPS way points and tracks in QGIS over some WMS (web mapping service) base map layers. I recently switched to QGIS 3 since I need to use that in my book (by the time it comes out 2.18 will be old news), and had to spend time starting from scratch since the plugin I always used was no longer available (ahhh the pitfalls of relying on 3rd party plugins – see my last post on SQLite). I thought I’d share what I learned here.
I was using the OpenLayers plugin in QGIS 2.x as an easy resource to add base maps to my projects. You could pull in layers from OSM, Google, Bing, and others. It turns out that plugin is no longer available for QGIS 3.x. So I searched around and found some suggestions for a different plugin called QuickMapServices which was a great replacement. But alas, that worked in QGIS 3.0 but is not compatible (as of now) for QGIS 3.2.
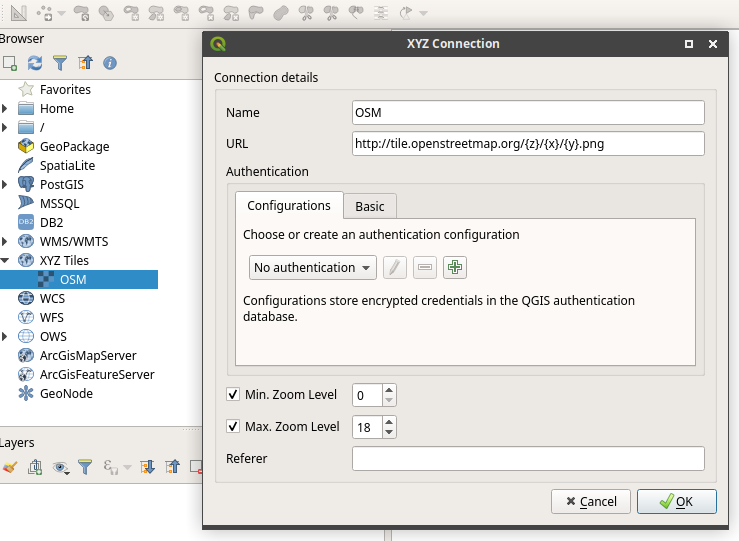
So I’m back to adding WMS layers manually. There is a new feature in QGIS for adding XYZ Tiles; this is a little better than WMS because the base map can be rendered a bit quicker. I found a tip in the Stack Exchange that you can add an OSM tiles layer with this url:
http://tile.openstreetmap.org/{z}/{x}/{y}.png
Select XYZ Tiles in the Browser, right click, New connection, give it a name, add the URL. You can modify the X Y Z coordinates where the map centers and zooms by default. Once you’ve created the connection, you can simply drag the OSM layer into the map window to render it.
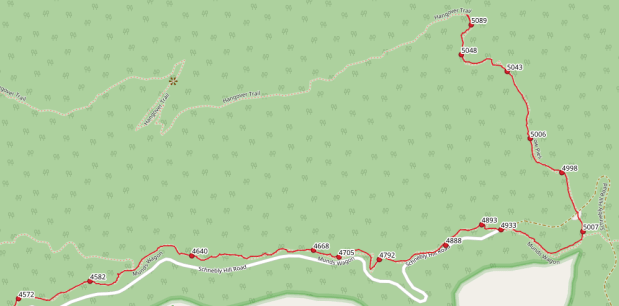
One problem that always creeps up: when you add other layers and adjust the zoom, sometimes the rendering of the base map looks poor, i.e. the features and labels look blurry or blocky. When you’re pulling data from a web map layer, as you zoom in it swaps out the tiles for more detailed ones appropriate for that scale. But when you’re zooming in QGIS things can get out of synch, as your map window zoom may not be enough to trigger the switch in the map tiles, or those map tiles are just not meant to be rendered at that scale. If you right click on a blank area of the toolbar, you can activate the Tile Scale panel and can use the slider to adjust the window zoom in synch with the tiles, so you can operate at the scales that are appropriate for the tiles. The way points and track for our hike alongside Schnebly Hill Road are shown below, and the labels for the points represent our elevation in feet.
If the slider is grayed out, select the OSM layer in the Layers menu, right click, and select Set CRS – Set Project CRS From Layer. Web mapping services typically use EPSG 3857 Pseudo Mercator as the coordinate reference system / map projection by default. If your other vectors layers aren’t in that system, you can have the base map draw to their system or vice versa by selecting the layer, right clicking, and choosing Set CRS. But for the tile scale to work properly EPSG 3857 must be the project CRS.
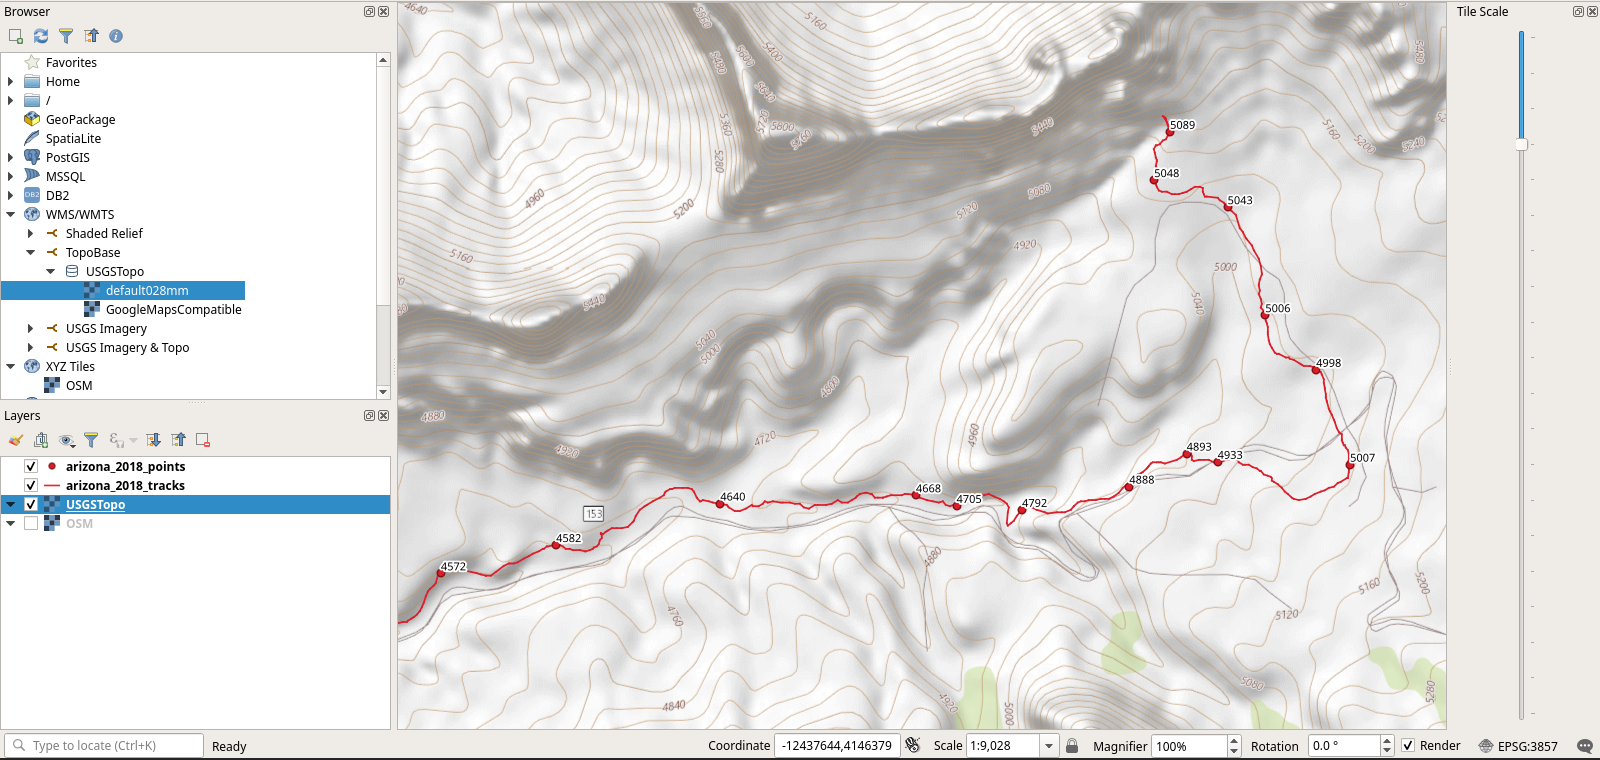
Lastly, I’ve always liked the USGS WMS layers, which are never included in the plugins that I’ve seen. The USGS provides layers for: imagery, imagery with topographic features, shaded relief, and the USGS topographic map layer:
You can click on one of the services, and at the top (in small print) are urls for their services in WMS and WMTS. The last one is a web mapping tile service, which is a bit faster than WMS. Click on the WMTS link, and copy the url from the address in the browser. Then in QGIS select WMS / WMTS layers, right click, add a new connection, give it a name and paste the url. This is url for the topographic map:
Once again, you can drag the layer into the map window to render it, and you can use the Tile Scale panel to adjust the zoom. Here’s our hike with the topo map as the base:


You must be logged in to post a comment.