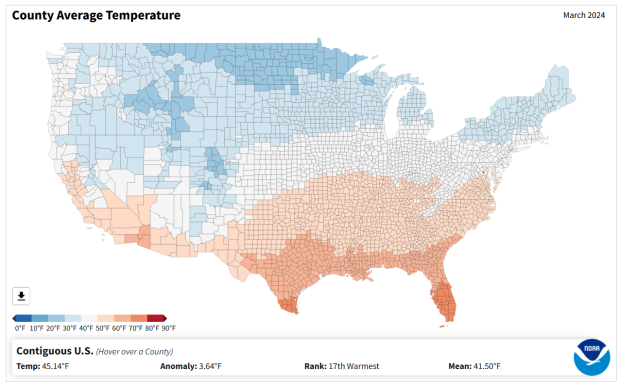
I recently had a question about finding historic climate data in the United States at the county-level. In this post I’ll show you how to access it, and how to parse fixed-width text files in Excel. Weather data is captured and reported by point-based weather stations, and then is often interpolated and modeled over gridded surfaces (rasters). The National Centers for Environmental Information at NOAA have used their models to create zonal statistics for counties, which they publish via the Climate at a Glance County Mapping program (I described what zonal statistics are in an earlier post).
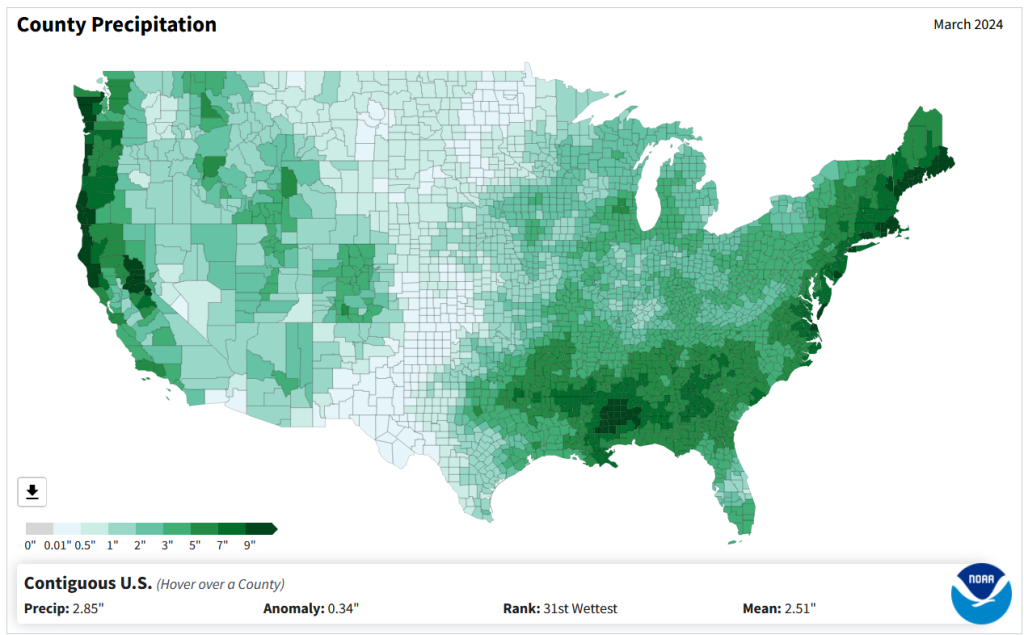
The basic application lets you map the continental US or an individual state (includes AK but not HI). You choose a parameter (Avg / Min / Max temperature, precipitation, cooling / heating days, drought indexes), year (1895 to present), month, and time scale (1 month to 5 years). This creates a map that you can modify to depict that value, or to display ranks or anomalies. You can download the map as an image, or the underlying data as CSV or JSON.
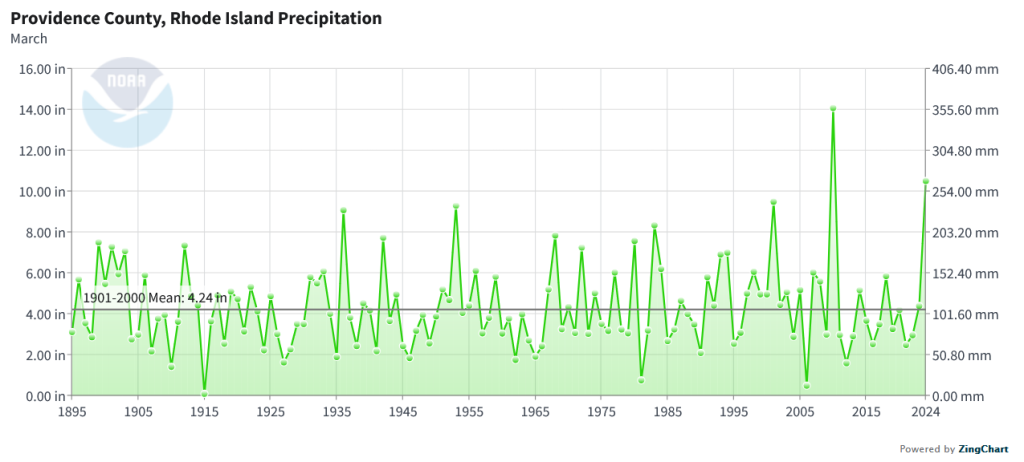
A separate app allows you to create a time series profile for a particular county, with a table, chart, and data that you can download.
These apps are great for the basics, but bulk downloading the underlying data for all counties and years is a bit trickier. You crash land in a file directory and have to choose from an array of zipped files. Fortunately there is good documentation. In that folder, these are the county-level files for precipitation, min temp, max temp, and avg temp:
- climdiv-pcpncy-vx.y.z-YYYYMMDD
- climdiv-tmaxcy-vx.y.z-YYYYMMDD
- climdiv-tmincy-vx.y.z-YYYYMMDD
- climdiv-tmpccy-vx.y.z-YYYYMMDD
Where v is for “version”, the xyz is a version number, and the final portion is the date. The archive is updated monthly. The other files in the directory are for climate divisions, states and regions, and data that pertains to the drought indexes. There are also files that have climate normals for each of these areas. If you’re interested in these, you can go up to the parent-level directory and view the relevant documentation.
The county files are fixed-width text files, which means you have to parse them to separate the values. If you treat them as delimited files (using spaces), then all of the fields at the beginning of the file will be lumped together, which is not useful. Spreadsheets and stats packages have tools for importing delimited text, or you could script something in Python or R. Modern versions of Excel will allow you to parse fixed-width data by supplying a list of endpoints for each column; older versions of Excel and other spreadsheets have you “eyeball” the columns and manually insert breaks in an import screen.
If you’re using a modern version of Excel: open a blank workbook and on the Data ribbon click the From Text/CSV button. Browse and select the county text file you’ve downloaded. In the import screen change the Delimiter drop down to Fixed Width.

In the box underneath, begin with zero and type the end points for each position (with the exception of the final endpoint, 95) as a comma separated list. You’ll find these in the README file, but I’ve also tacked on the most salient bits to the end of this post. For your convenience:
0,5,7,11,18,25,32,39,46,53,60,67,74,81,88If you click on the preview grid, it will parse the columns.
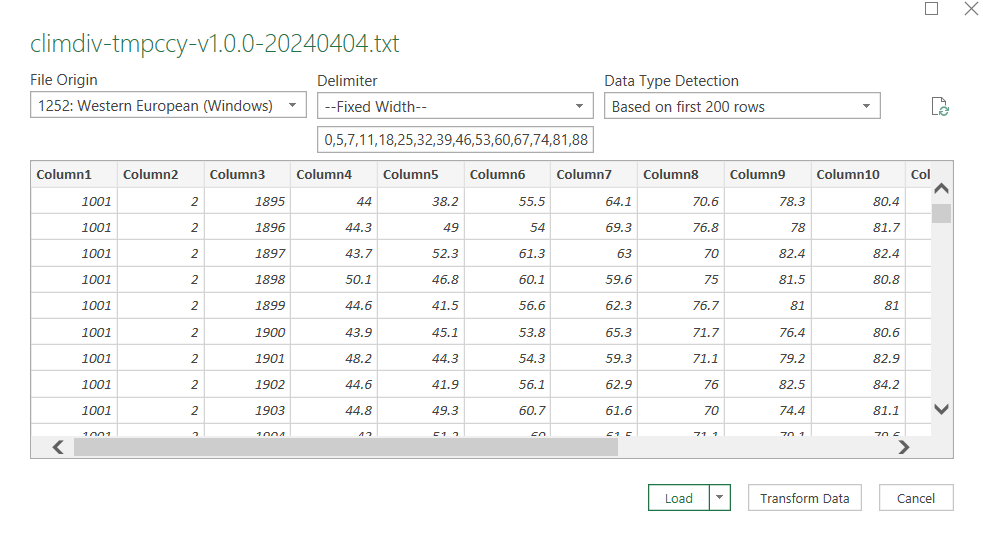
In this example, I’m not parsing the state and county code separately, but am keeping them together to create a single unique identifier. Once everything is parsed, hit the Transform Data button. For column 1, hit the small 123 button, and change the option to Text, and choose Replace data.
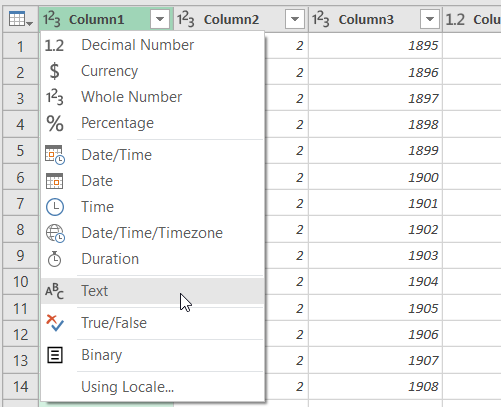
This will preserve the leading zero in the state/county code. It’s important to do this, so the codes in this table with match the codes in other county data table or spatial data files that you may wish to join this table to. Do the same for the element code in column 2. The remaining Year and Month columns can be left alone, as they’re already appropriately saved as integers and decimals respectively.

Hit the Close and Load button in the upper left hand corner, and Excel will parse and load the data. It formats the columns and applies a filter option. To get rid of the styling and filter dropdowns, I’d copy the entire table, and do a Paste-Special-Values in a new worksheet. Then replace the generic column labels with these:
CNTYCODE,ELEMENT,YEAR,JAN,FEB,MAR,APR,MAY,JUNE,JULY,AUG,SEPT,OCT,NOV,DEC
Save the file, and now you have something to work with. Each record represents the monthly temperature or precipitation for a particular county for a particular year. To create a unique record ID, you can concatenate the state/county code, element code, and year values. For GIS applications, you would need to pivot the data to a wide form, so that the year becomes a column to give you month-year as a column, and each row represents each county with no repeats. With over 120 years of monthly data, that would give you over 1500 columns – so filter out what you don’t need. The state / county code can be used to join the table to the Census Bureau’s Cartographic Boundary Files, using the CBF’s GEOID field.
When would you use this data? If you’re creating data profiles or are running a statistical analysis and are using counties as your geographic unit, and temperature or precipitation is one variable among many that you need. Or, you’re making a series of county-level maps, and this is one of your variables. This dataset is clearly pretty convenient for doing time series analyses, as compiling data for a times series is usually time consuming. The counties in this dataset represent present day boundaries, so normalizing geography over time isn’t necessary.
When not to use it? Counties vary in size and can encompass a great deal of internal variety in terms of elevation, land use and land cover, and proximity to / presence of water bodies, all of which impact the climate. So the weather in one part of a county could be quite different from another part. To capture these internal differences, it would be better to use gridded data, such as the 4×4 km rasters that PRISM produces for daily, monthly, annual, and normal summaries.
Gridded climate data and zonal stats derived from grids are estimates based on models; if you wanted or needed the actual measurements as they were recorded, you would need to go back and get point-based weather station data, from the Local Climatological Database for instance. There are a limited number of stations, and not one for every county. The closest station to a given place could be used to represent or approximate the weather for that place.
Codebook for county data files (extracted from README):
Element Record
Name Position Element Description
STATE-CODE 1-2 as indicated in State Code Table as described in FILE 1. Range of values is 01-48.DIVISION-NUMBER 3-5 COUNTY FIPS - Range of values 001-999.ELEMENT CODE 6-7 01 = Precipitation
02 = Average Temperature
25 = Heating Degree Days
26 = Cooling Degree Days
27 = Maximum Temperature
28 = Minimum TemperatureYEAR 8-11 This is the year of record. Range is 1895 to current year processed. Monthly Divisional Temperature format (f7.2) Range of values -50.00 to 140.00 degrees Fahrenheit. Decimals retain a position in the 7-character field. Missing values in the latest year are indicated by -99.99.
Monthly Divisional Precipitation format (f7.2) Range of values 00.00 to 99.99. Decimal point retains a position in the 7-character field. Missing values in the latest year are indicated by -9.99.
JAN-VALUE 12-18
FEB-VALUE 19-25
MAR-VALUE 26-32
APR-VALUE 33-39
MAY-VALUE 40-46
JUNE-VALUE 47-53
JULY-VALUE 54-60
AUG-VALUE 61-67
SEPT-VALUE 68-74
OCT-VALUE 75-81
NOV-VALUE 82-88
DEC-VALUE 89-95