A few months ago I had a new article published in LISR, but given the absurd restrictions of academic journal publishing I’m not allowed to publicly post the article, and have to wait 12 months before sharing my post-print copy. It is available via your local library if they have a subscription to the Science Direct database (you can also email me to request a copy). .
Citation and Abstract
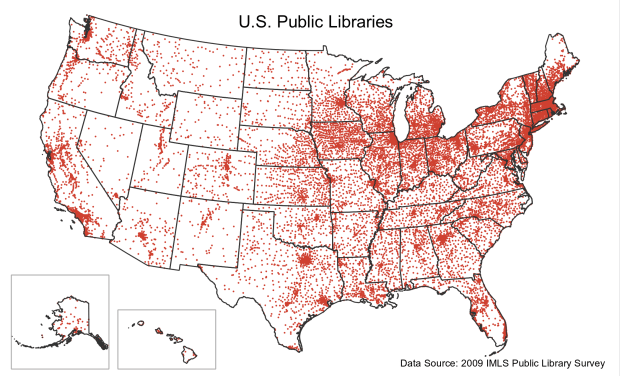
Regional variations in average distance to public libraries in the United States
F. Donnelly
Library & Information Science Research
Volume 37, Issue 4, October 2015, Pages 280–289
http://dx.doi.org/10.1016/j.lisr.2015.11.008
Abstract
“There are substantive regional variations in public library accessibility in the United States, which is a concern considering the civic and educational roles that libraries play in communities. Average population-weighted distances and the total population living within one mile segments of the nearest public library were calculated at a regional level for metropolitan and non-metropolitan areas, and at a state level. The findings demonstrate significant regional variations in accessibility that have been persistent over time and cannot be explained by simple population distribution measures alone. Distances to the nearest public library are higher in the South compared to other regions, with statistically significant clusters of states with lower accessibility than average. The national average population-weighted distance to the nearest public library is 2.1 miles. While this supports the use of a two-mile buffer employed in many LIS studies to measure library service areas, the degree of variation that exists between regions and states suggests that local measures should be applied to local areas.”
Purpose
I’m not going to repeat all the findings, but will provide some context.
As a follow-up to my earlier work, I was interested in trying an alternate approach for measuring public library spatial equity. I previously used the standard container approach – draw a buffer at some fixed distance around a library and count whether people are in or out, and as an approximation for individuals I used population centroids for census tracts. In my second approach, I used straight-line distance measurements from census block groups (smaller than tracts) to the nearest public library so I could compare average distances for regions and states; I also summed populations for these areas by calculating the percentage of people that lived within one-mile rings of the nearest library. I weighted the distances by population, to account for the fact that census areas vary in population size (tracts and block groups are designed to fall within an ideal population range – for block groups it’s between 600 and 3000 people).
Despite the difference in approach, the outcome was similar. Using the earlier approach (census tract centroids that fell within a library buffer that varied from 1 to 3 miles based on urban or rural setting), two-thirds of Americans fell within a “library service area”, which means that they lived within a reasonable distance to a library based on standard practices in LIS research. Using the latest approach (using block group centroids and measuring the distance to the nearest library) two-thirds of Americans lived within two miles of a public library – the average population weighted distance was 2.1 miles. Both studies illustrate that there is a great deal of variation by geographic region – people in the South consistently lived further away from public libraries compared to the national average, while people in the Northeast lived closer. Spatial Autocorrelation (LISA) revealed a cluster of states in the South with high distances and a cluster in the Northeast with low distances.
The idea in doing this research was not to model actual travel behavior to measure accessibility. People in rural areas may be accustomed to traveling greater distances, public transportation can be a factor, people may not visit the library that’s close to their home for several reasons, measuring distance along a network is more precise than Euclidean distance, etc. The point is that libraries are a public good that provide tangible benefits to communities. People that live in close proximity to a public library are more likely to reap the benefits that it provides relative to those living further away. Communities that have libraries will benefit more than communities that don’t. The distance measurements serve as a basic metric for evaluating spatial equity. So, if someone lives more than six miles away from a library that does not mean that they don’t have access; it does means they are less likely to utilize it or realize it’s benefits compared to someone who lives a mile or two away.
Data
I used the 2010 Census at the block group level, and obtained the location of public libraries from the 2010 IMLS. I improved the latter by geocoding libraries that did not have address-level coordinates, so that I had street matches for 95% of the 16,720 libraries in the dataset. The tables that I’m providing here were not published in the original article, but were tacked on as supplementary material in appendices. I wanted to share them so others could incorporate them into local studies. In most LIS research the prevailing approach for measuring library service areas is to use a buffer of 1 to 2 miles for all locations. Given the variation between states, if you wanted to use the state-average for library planning in your own state you can consider using these figures.
To provide some context, the image below shows public libraries (red stars) in relation to census block group centroids (white circles) for northern Delaware (primarily suburban) and surrounding areas (mix of suburban and rural). The line drawn between the Swedesboro and Woodstown libraries in New Jersey is 5-miles in length. I used QGIS and Spatialite for most of the work, along with Python for processing the data and Geoda for the spatial autocorrelation.

The three tables I’m posting here are for states: one counts the 2010 Census population within one to six mile rings of the nearest public library, the second is the percentage of the total state population that falls within that ring, and the third is a summary table that calculates the mean and population-weighted distance to the nearest library by state. One set of tables is formatted text (for printing or just looking up numbers) while the other set are CSV files that you can use in a spreadsheet. I’ve included a metadata record with some methodological info, but you can read the full details in the article.
In the article itself I tabulated and examined data at a broader, regional level (Northeast, Midwest, South, and West), and also broke it down into metropolitan and non-metropolitan areas for the regions. Naturally people that live in non-metropolitan areas lived further away, but the same regional patterns existed: more people in the South in both metro and non-metro areas lived further away compared to their counterparts in other parts of the country. This weekend I stumbled across this article in the Washington Post about troubles in the Deep South, and was struck by how these maps mirrored the low library accessibility maps in my past two articles.
