In late summer and early fall I was hammering out the draft for an ALA Tech Report on using census data for research (slated for release early 2022). The earliest 2020 census figures have been released and there are several issues surrounding this, so I’ll provide a summary of what’s happening here. Throughout this post I link to Census Bureau data sources, news bulletins, and summaries of trends, as well as analysis on population trends from Bill Frey at Brookings and reporting from Hansi Lo Wang and his colleagues at NPR.
Count Result and Reapportionment Numbers
The re-apportionment results were released back in April 2020, which provided the population totals for the US and each of the states that are used to reallocate seats in Congress. This data is typically released at the end of December of the census year, but the COVID-19 pandemic and political interference in census operations disrupted the count and pushed all the deadlines back.
Despite these disruptions, the good news is that the self-response rate, which is the percentage of households who submit the form on their own without any prompting from the Census Bureau, was 67%, which is on par with the 2010 census. This was the first decennial census where the form could be submitted online, and of the self-responders 80% chose to submit via the internet as opposed to paper or telephone. Ultimately, the Bureau said it reached over 99% of all addresses in its master address file through self-response and non-response follow-ups.
The bad news is that the rate of non-response to individual questions was much higher in 2020 than in 2010. Non-responses ranged from a low of 0.52% for the total population count to a high of 5.95% for age or date of birth. This means that a higher percentage of data will have to be imputed, but this time around the Bureau will rely more on administrative records to fill the gaps. They have transparently posted all of the data about non-response for researchers to scrutinize.
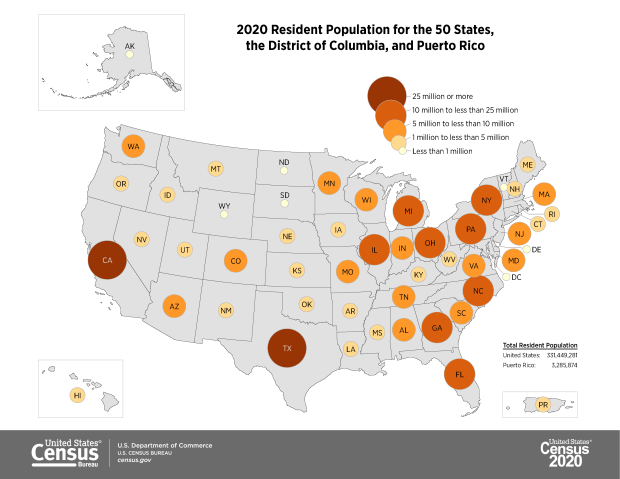
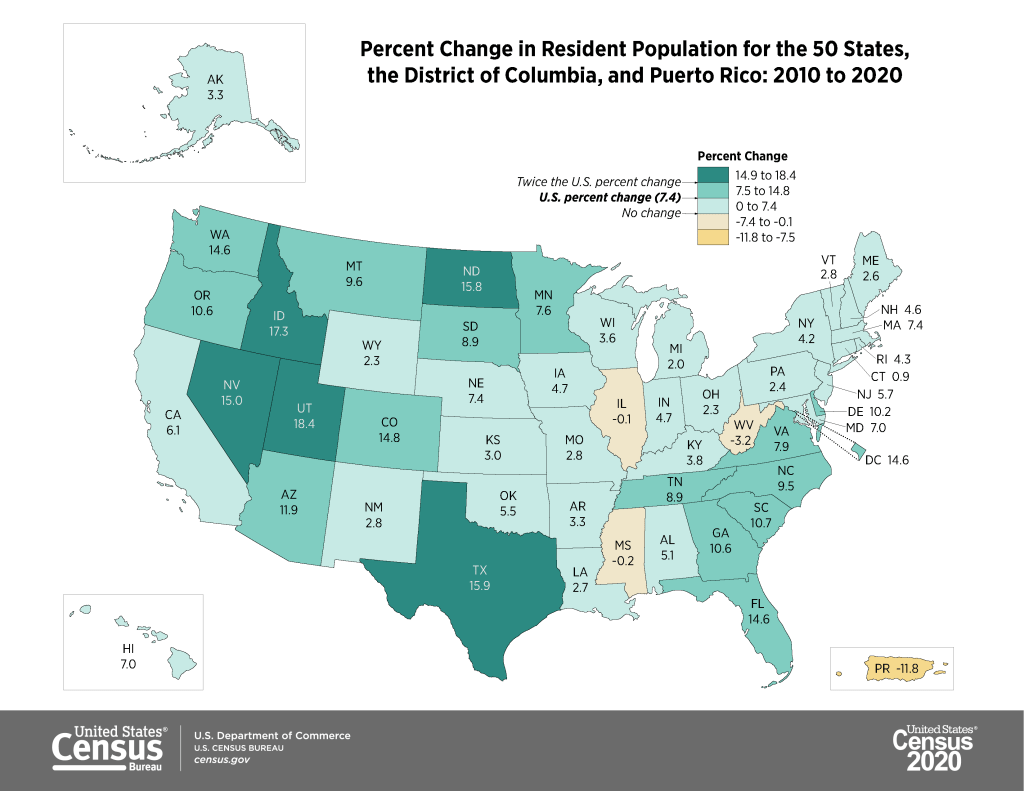
The apportionment results showed that the population of the US grew from approximately 309 million in 2010 to 331 million in 2020, a growth rate of 7.35%. This is the lowest rate of population growth since the 1940 census that followed the Great Depression. Three states lost population (West Virginia, Mississippi, and Illinois), which is the highest number since the 1980 census. The US territory of Puerto Rico lost almost twelve percent of its population. Population growth continues to be stronger in the West and South relative to the Northeast and Midwest, and the fastest growing states are in the Mountain West.
Public Redistricting Data
The first detailed population statistics were released as part of the redistricting data file, PL 94-171. Data in this series is published down to the block level, the smallest geography available, so that states can redraw congressional and other voting districts based on population change. Normally released at the end of March, this data was released in August 2021. This is a small package that contains the following six tables:
- P1. Race (includes total population count)
- P2. Hispanic or Latino, and Not Hispanic or Latino by Race
- P3. Race for the Population 18 Years and Over
- P4. Hispanic or Latino, and Not Hispanic or Latino by Race for the Population 18 Years and
Over - P5. Group Quarters Population by Major Group Quarters Type
- H1. Occupancy Status (includes total housing units)
The raw data files for each state can be downloaded from the 2020 PL 94-171 page and loaded into stats packages or databases. That page also provides infographics (including the maps embedded in this post) and data summaries. Data tables can be readily accessed via data.census.gov, or via IPUMS NHGIS.
The redistricting files illustrate the increasing diversity of the United States. The number of people identifying as two or more races has grown from 2.9% of the total population in 2010 to 10.2% in 2020. Hispanics and Latinos continue to be the fastest growing population group, followed by Asians. The White population actually shrank for the first time in the nation’s history, but as NPR reporter Hansi-Lo Wang and his colleagues illustrate this interpretation depends on how one measures race; as race alone (people of a single race) or persons of any race (who selected white and another race), and whether or not Hispanic-whites are included with non-Hispanic whites (as Hispanic / Latino is not a race, but is counted separately as an ethnicity, and most Hispanics identify their race as White or Other). The Census Bureau has also provided summaries using the different definitions. Other findings: the nation is becoming progressively older, and urban areas outpaced rural ones in population growth. Half of the counties in the US lost population between 2010 and 2020, mostly in rural areas.

2020 Demographic and Housing Characteristics and the ACS
There still isn’t a published timeline for the release of the full results in the Demographic and Housing Characteristics File (DHC – known as Summary File 1 in previous censuses, I’m not sure if the DHC moniker is replacing the SF1 title or not). There are hints that this file is going to be much smaller in terms of the number of tables, and more limited in geographic detail compared to the 2010 census. Over the past few years there’s been a lot of discussion about the new differential privacy mechanisms, which will be used to inject noise into the data. The Census Bureau deemed this necessary for protecting people’s privacy, as increased computing power and access to third party datasets have made it possible to reverse engineer the summary census data to generate information on individuals.
What has not been as widely discussed is that many tables will simply not be published, or will only be summarized down to the county-level, also for the purpose of protecting privacy. The Census Bureau has invited the public to provide feedback on the new products and has published a spreadsheet crosswalking products from 2010 and 2020. IPUMS also released a preliminary list of tables that could be cut or reduced in specificity (derived from the crosswalk), which I’m republishing at the bottom of this post. This is still preliminary, but if all these changes are made it would drastically reduce the scope and specificity of the decennial census.
And then… there is the 2020 American Community Survey. Due to COVID-19 the response rates to the ACS were one-third lower than normal. As such, the sample is not large or reliable enough to publish the 1-year estimate data, which is typically released in September. Instead, the Census will publish a smaller series of experimental tables for a more limited range of geographies at the end of November 2021. There is still no news regarding what will happen with the 5-year estimate series that is typically released in December.
Needless to say, there’s no shortage of uncertainty regarding census data in 2020.
Tables in 2010 Summary File 1 that Would Have Less Geographic Detail in 2020 (Proposed)
| Table Name | Proposed 2020 Lowest Level of Geography | 2010 Lowest Level of Geography |
|---|---|---|
| Hispanic or Latino Origin of Householder by Race of Householder | County | Block |
| Household Size by Household Type by Presence of Own Children | County | Block |
| Household Type by Age of Householder | County | Block |
| Households by Presence of People 60 Years and Over by Household Type | County | Block |
| Households by Presence of People 60 Years and Over, Household Size, and Household Type | County | Block |
| Households by Presence of People 75 Years and Over, Household Size, and Household Type | County | Block |
| Household Type by Household Size | County | Block |
| Household Type by Household Size by Race of Householder | County | Block |
| Relationship by Age for the Population Under 18 Years | County | Block |
| Household Type by Relationship for the Population 65 Years and Over | County | Block |
| Household Type by Relationship for the Population 65 Years and Over by Race | County | Block |
| Family Type by Presence and Age of Own Children | County | Block |
| Family Type by Presence and Age of Own Children by Race of Householder | County | Block |
| Age of Grandchildren Under 18 Years Living with A Grandparent Householder | County | Block |
| Household Type by Relationship by Race | County | Block |
| Average Household Size by Age | To be determined | Block |
| Household Type for the Population in Households | To be determined | Block |
| Household Type by Relationship for the Population Under 18 Years | To be determined | Block |
| Population in Families by Age | To be determined | Block |
| Average Family Size by Age | To be determined | Block |
| Family Type and Age for Own Children Under 18 Years | To be determined | Block |
| Total Population in Occupied Housing Units by Tenure | To be determined | Block |
| Average Household Size of Occupied Housing Units by Tenure | To be determined | Block |
| Sex by Age for the Population in Households | County | Tract |
| Sex by Age for the Population in Households by Race | County | Tract |
| Presence of Multigenerational Households | County | Tract |
| Presence of Multigenerational Households by Race of Householder | County | Tract |
| Coupled Households by Type | County | Tract |
| Nonfamily Households by Sex of Householder by Living Alone by Age of Householder | County | Tract |
| Group Quarters Population by Sex by Age by Group Quarters Type | State | Tract |
Tables in 2010 Summary File 1 That Would Be Eliminated in 2020 (Proposed)
| Population in Households by Age by Race of Householder |
| Average Household Size by Age by Race of Householder |
| Households by Age of Householder by Household Type by Presence of Related Children |
| Households by Presence of Nonrelatives |
| Household Type by Relationship for the Population Under 18 Years by Race |
| Household Type for the Population Under 18 Years in Households (Excluding Householders, Spouses, and Unmarried Partners) |
| Families* |
| Families by Race of Householder* |
| Population in Families by Age by Race of Householder |
| Average Family Size by Age by Race of Householder |
| Family Type by Presence and Age of Related Children |
| Family Type by Presence and Age of Related Children by Race of Householder |
| Group Quarters Population by Major Group Quarters Type* |
| Population Substituted |
| Allocation of Population Items |
| Allocation of Race |
| Allocation of Hispanic or Latino Origin |
| Allocation of Sex |
| Allocation of Age |
| Allocation of Relationship |
| Allocation of Population Items for the Population in Group Quarters |
| American Indian and Alaska Native Alone with One Tribe Reported for Selected Tribes |
| American Indian and Alaska Native Alone with One or More Tribes Reported for Selected Tribes |
| American Indian and Alaska Native Alone or in Combination with One or More Other Races and with One or More Tribes Reported for Selected Tribes |
| American Indian and Alaska Native Alone or in Combination with One or More Other Races |
| Asian Alone with One Asian Category for Selected Groups |
| Asian Alone with One or More Asian Categories for Selected Groups |
| Asian Alone or in Combination with One or More Other Races, and with One or More Asian Categories for Selected Groups |
| Native Hawaiian and Other Pacific Islander Alone with One Native Hawaiian and Other Pacific Islander Category for Selected Groups |
| Native Hawaiian and Other Pacific Islander Alone with One or More Native Hawaiian and Other Pacific Islander Categories for Selected Groups |
| Native Hawaiian and Other Pacific Islander Alone or in Combination with One or More Races, and with One or More Native Hawaiian and Other Pacific Islander Categories for Selected Groups |
| Hispanic or Latino by Specific Origin |
| Sex by Single Year of Age by Race |
| Household Type by Number of Children Under 18 (Excluding Householders, Spouses, and Unmarried Partners) |
| Presence of Unmarried Partner of Householder by Household Type for the Population Under 18 Years in Households (Excluding Householders, Spouses, and Unmarried Partners) |
| Nonrelatives by Household Type |
| Nonrelatives by Household Type by Race |
| Group Quarters Population by Major Group Quarters Type by Race |
| Group Quarters Population by Sex by Major Group Quarters Type for the Population 18 Years and Over by Race |
| Total Races Tallied for Householders |
| Hispanic or Latino Origin of Householders by Total Races Tallied |
| Total Population in Occupied Housing Units by Tenure by Race of Householder |
| Average Household Size of Occupied Housing Units by Tenure |
| Average Household Size of Occupied Housing Units by Tenure by Race of Householder |
| Occupied Housing Units Substituted |
| Allocation of Vacancy Status |
| Allocation of Tenure |
| Tenure by Presence and Age of Related Children |
