Last week, the Census Bureau released the latest 5-year estimates for the American Community Survey for 2016-2020. This latest dataset uses the new 2020 census geography, which means if you’re focused on using the latest data, you can finally move away from the 2010-based geography which had been used for the ACS from 2010 to 2019 (with some caveats: 2020 ZCTAs won’t be utilized until the 2021 ACS, and 2020 PUMAs until 2022). As always, mappers have a choice between the TIGER Line files that depict the precise boundaries, or the generalized cartographic boundary files with smoothed lines and large sections of coastal water bodies removed to depict land areas. The 2016-2020 ACS data is available via data.census.gov and the ACS API.
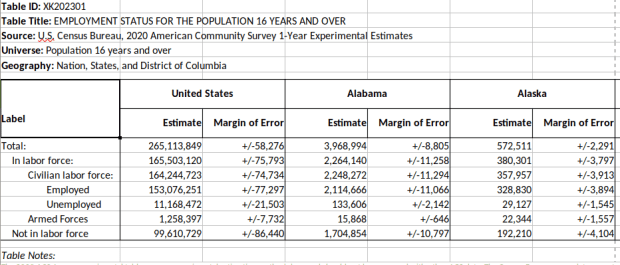
This release is over 3 months late (compared to normal), and there was some speculation as to whether it would be released at all. The pandemic (chief among several other disruptive events) hampered 2020 decennial census and ACS operations. The 1-year 2020 ACS numbers were released over 2 months later than usual, in late November 2021, and were labeled as an experimental release. Instead of the usual 1,500 plus tables in 40 subject areas for all geographic areas with over 65,000 people, only 54 tables were released for the 50 states plus DC. This release is only available from the experimental tables page and is not being published via data.census.gov.
What happened? The details were published in a working paper, but in summary fewer addresses were sampled and the normal mail out and follow-up procedures were disrupted (pg 8). The overall sample size fell from 3.5 to 2.9 million addresses due to reduced mailing between April and June 2020 (pg 18), and total interviews fell from 2 million to 1.4 million with most of the reductions occurring in spring and summer (pg 18). The overall housing unit response rate for 2020 was 71%, down from 86% in 2019 and 92% in 2018 (pg 20). The response rate for the group quarters population fell from 91% in 2019 to 47% in 2020 (pg 21). Responses were differential, varying by time period (with the lowest rates during the peak pandemic months) and geography. Of the 818 counties that meet the 65k threshold, response rates in some were below 50% (pg 21). The data contained a large degree of non-response bias, where people who did respond to the survey had significantly different social, economic and housing characteristics from those who didn’t. As a consequence of all of this, margins of error for the data increased by 20 to 30% over normal (pg 18).
Thus, 2020 will represent a hole in the ACS estimates series. The Bureau made adjustments to weighting mechanisms to produce the experimental 1-year estimates, but is generally advising policy makers and researchers who normally use this series to choose alternatives: either the 1-year 2019 ACS, or the 5-year 2016-2020 ACS. The Bureau was able to make adjustments to produce satisfactory 5-year estimates to reduce non-response bias, and the 5-year pool of samples is balanced somewhat by having at least 4 years of good data.
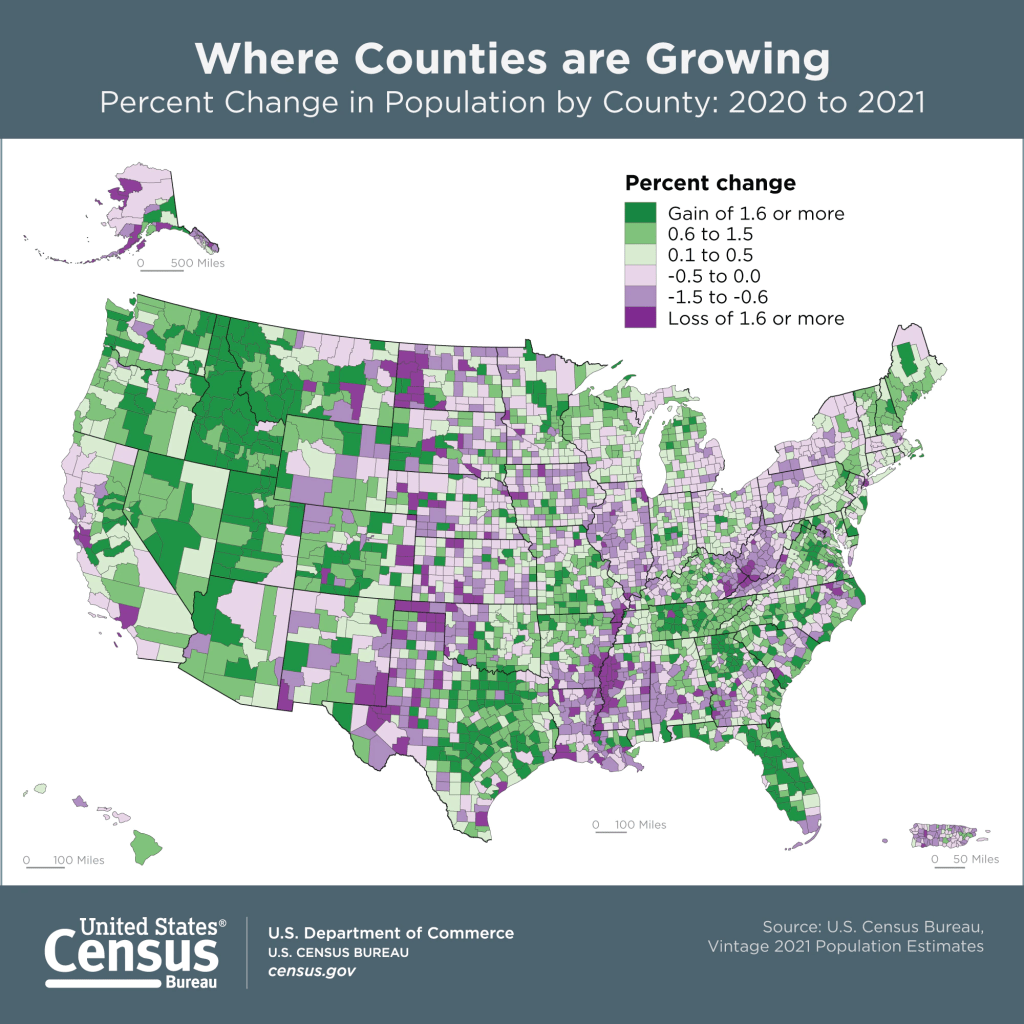
The Population Estimates Program has also released its latest series of vintage 2021 estimates for counties and metropolitan areas. This dataset gives us a pretty sharp view of how the pandemic affected the nation’s population. Approximately 73% of all counties experienced natural decrease in 2021 (between July 1st 2020 and 2021), where the number of deaths outnumbered births. In contrast, 56% of counties had natural decrease in 2020 and 46% in 2019. Declining birth rates and increasing death rates are long term trends, but COVID-19 magnified them, given the large number of excess deaths on one hand and families postponing child birth due to the virus on the other hand. Net foreign migration continued its years-long decline, but net domestic migration increased in a number of places, reflecting pandemic moves. Medium to small counties benefited most, as did large counties in the Sunbelt and Mountain West. The biggest losers in overall population were counties in California (Los Angeles, San Francisco, and Alameda), Cook County (Chicago), and the counties that constitute the boroughs of NYC.