Over the course of this academic year I’ve helped many students find GIS data related to coastal storms and flooding in the US. There’s a ton of data available, particularly from NOAA, but there are so many projects and initiatives that it can be tough to find what you’re looking for. So I’ll share a few key resources here.
NOAA’s DigitalCoast is a good place to start; it’s a catalog of federal, state, and US territory projects and websites that provide both spatial and non-spatial datasets related to coastal storms and flooding. You can filter by place and data type; there are even a few global sources. Most of the projects I mention below are cataloged there.
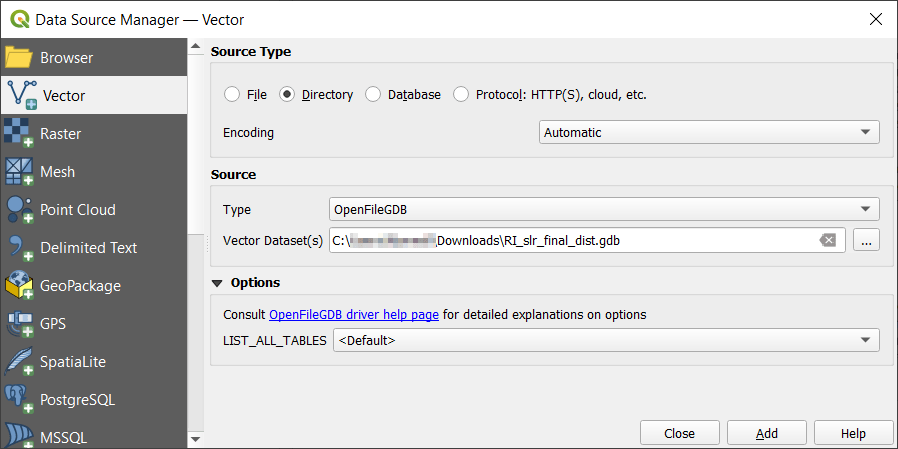
Given the size of many of these datasets, the ArcGIS File Geodatabase is often used for packaging and distribution. Once you’ve downloaded and unzipped one, it looks like a folder with lots of subfolders and files. If you’re an ArcGIS user, use the Catalog pane to browse your file system and add a connection to the database / folder to access its contents. If you’re a QGIS user, use the Data Manager and on the Vector tab change the source type from File to Directory. In the Source Type dropdown you can choose OpenFileGDB, and browse and select the database, which appears as a folder. Once you hit the Add button, you’ll be prompted to choose the features in the DB that you wish to add to the project.
FEMA Flood Hazards and Disasters
The FEMA flood maps are usually the first thing that comes to mind when folks set out to find data on flooding, but good luck finding their GIS data. I’ve searched through their main program site for the National Flood Hazard Layer and followed every link, but can’t for the life of me find the connection to the page that has actual GIS data; there are map viewer tools, scanned paper maps, web mapping services, and everything else under the sun.
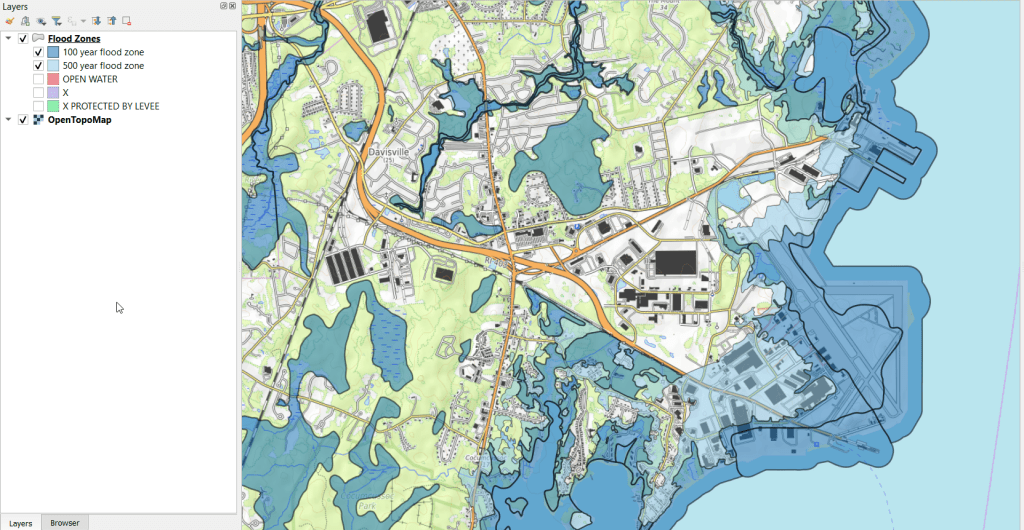
If you want FEMA flood data in a GIS format: GO HERE! You have to search by state, county, and jurisdiction, but after searching under Effective products at the bottom choose NFHL-Data State, and you’ll get the database for the whole state (or choose county if you prefer). The data is packaged in an ArcGIS File Geodatabase, and among the many layers there is a flood hazard area layer. Features are categorized into different types of flood zones, open water bodies, areas outside of flood zones, and areas outside flood zones protected by levees. The pic below illustrates 100 and 500 year zones overlaid on the OpenTopoMap.
FEMA also has a GIS data feed for current and historical emergencies and disasters, that are available in a variety of formats both spatial and non-spatial. These are county-level layers that indicate where disaster areas were declared and what kind of funding or assistance is / was available.
NOAA Sea Level Rise
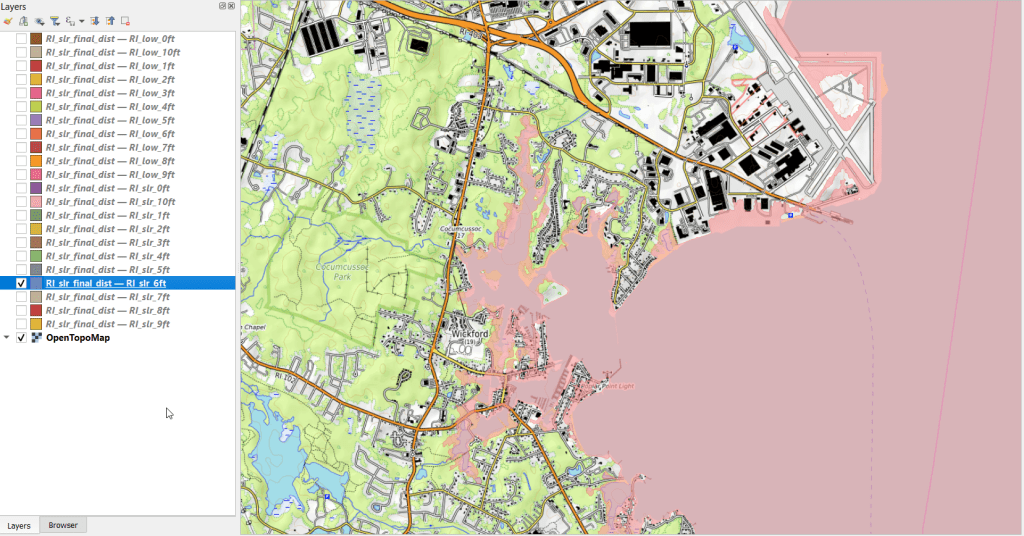
The FEMA maps assess both past events and current conditions to model the likelihood of flooding in a 100 or 500 year period for a major storm event. A different way of looking at flooding is to consider sea level rise due to climate change, where the impact of sea level rise is measured in different increments. Instead of the impact of a one-shot event, this illustrates potential long term change. NOAA’s Sea Level Rise (SLR) viewer allows you to easily visualize the impact of sea level rise in 1 foot increments, between 1 and 10 feet. You can download the data by US state or territory for coastal areas. There are separate downloads for sea level rise, rise depth, the confidence intervals for the models, as well as DEMs and flood frequency. The sea level rise data is package in an ArcGIS file geodatabase, with two sets of files (a low estimate and high estimate) in one foot increments. An example of 6 feet in sea level rise is shown below.
NOAA National Hurricane Center
Beyond showing the general impact of flooding or sea level rise, you can also look at the track of individual hurricanes and tropical storms. The National Hurricane Center’s GIS data page provides historical forecasts – the projected path and cone of storms, windspeeds, storm surges, etc. You choose your year, then can choose a storm, and then a particular day. You can use this data to see how the forecasts evolved as the storm moved. When we’re in hurricane season, you can also see what the circumstances are day by day for tracking new storms.
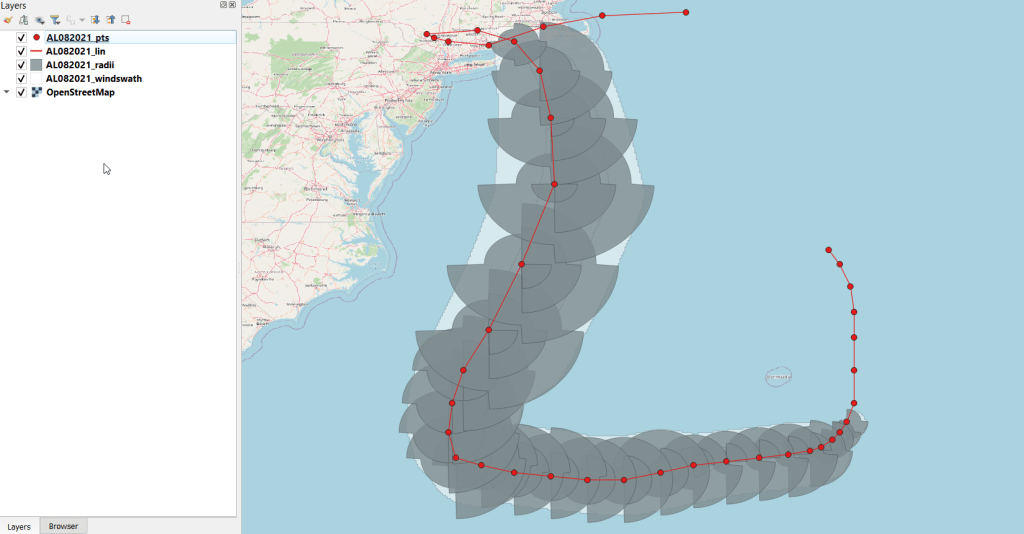
If you want to see what actually happened (as opposed to a forecast), you can dig through the data page and browse the different options. There’s the Tropical Cyclone Report (TCR) which provides “information on each tropical cyclone, including synoptic history, meteorological statistics, casualties and damages, and the post-analysis best track (six-hourly positions and intensities). Tropical cyclones include depressions, storms and hurricanes.” The default page shows you the Atlantic, but you can swap to Eastern or Central Pacific using the link at the top. Storms are listed alphabetically (and thus by date) and your format options are shapefile or KML. There’s a map at the bottom that depicts and labels all the storms for that season. You actually get four shapefiles in a download; a point file that contains a number of measurements, a line file for the storm track, a polygon file for the radius of the storm, and another polygon with the wind swath. The layers for 2021’s Tropical Storm Henri are illustrated below.
GIS data for the storms begins in 2010 with KMZ files (which you’ll need to convert in ArcGIS or QGIS to make them useful beyond display purposes), and shapefiles appear in 2015. Further back in time are just PDF reports and map scans.
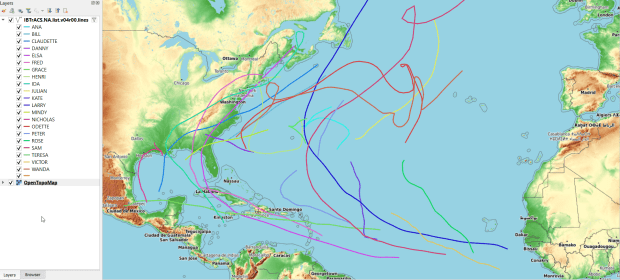
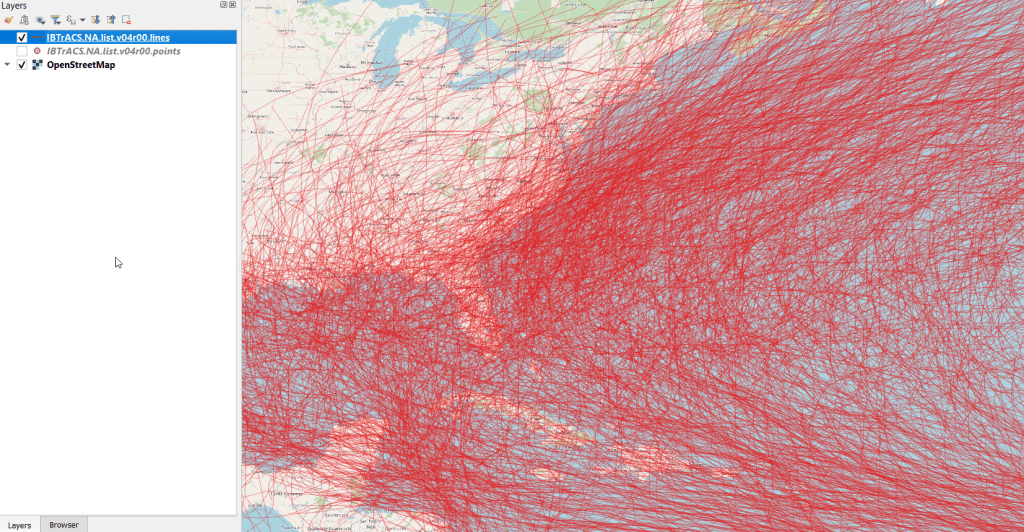
If you really want to go back and time and get all the tracks at once, there’s the HURDAT2 database; one for the Atlantic (1851 to present) and another for the Pacific (1949 to present). It’s a csv file that contains coordinates for the track of every storm, which you can process to create a geospatial file using a points to line tool. Or – you can grab a version where that’s already been created! The International Best Track Archive for Climate Stewardship (IBTrACS) keeps a running CSV and shapefile of all global storms. Scroll down and choose shapefile (CSV is another option). The download page is just a list of files – you can choose points or lines, storms by ocean (East Pacific, North Atlantic, North Indian, South Atlantic, South Indian, South Pacific, West Pacific), or grab everything in lists that are: active, everything (ALL), last 3 years, or since 1980. Below is an example of all storms in the North Atlantic – there are quite a lot (see below)! You get storm speed and direction, wind speed and direction, coordinates, and identifiers associated with the storm as points and lines. A subset of this data for the 2021 season is displayed in the feature image at the top of this post.
How About the Weather?
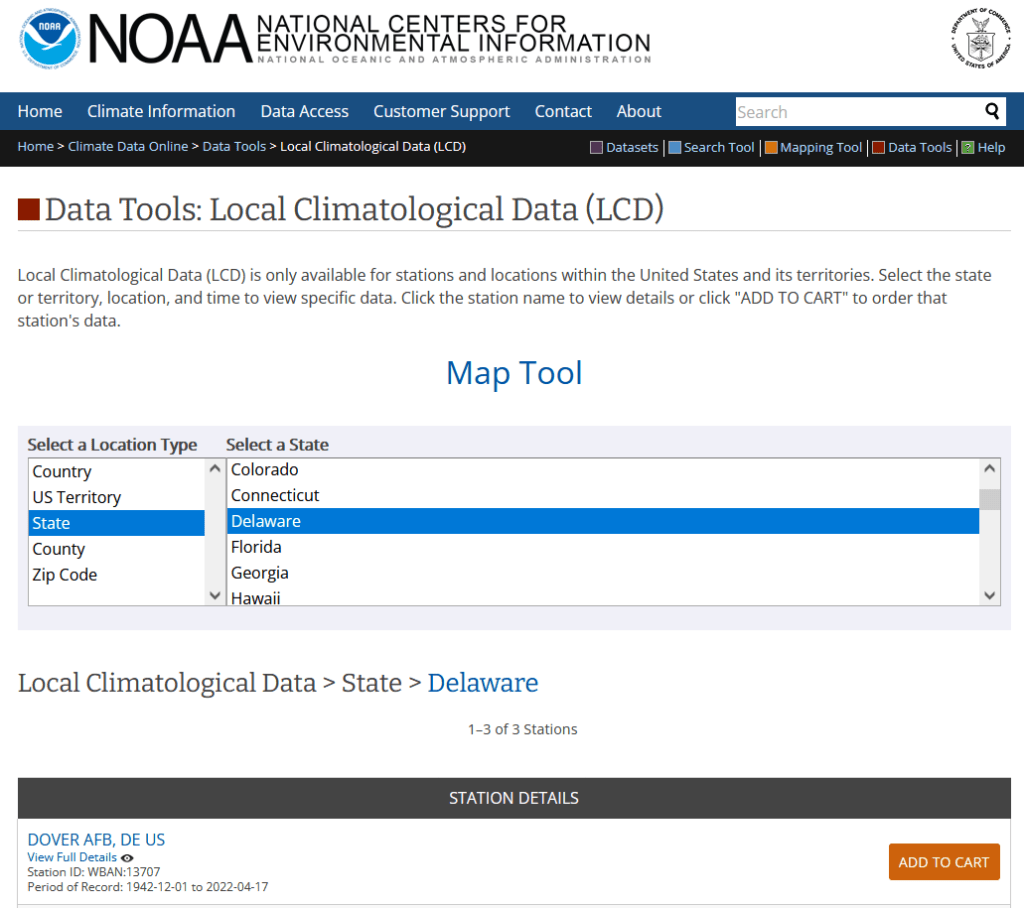
There are many places you can go for this and the best source depends on the use case. More often than not, I end up using the Local Climatological Database. Choose a geographic type, then a specific area, and you’ll see all the weather stations in this area. Add them to the cart, and then view the cart once you have all the stations you want. On the next screen choose an output format (CSV or TXT fixed width) and a date range. You submit an order and wait a bit for it to be compiled, and are notified by email when it’s ready for download. Mixed in this CSV are records that are monthly, daily, and hourly, so after downloading you’ll want to extract just the period you’re interested in. Data includes temperature, precipitation, dew point, wind speed and direction, humidity, barometric pressure, and cloud cover.
Some processing is required to make these files GIS ready. Each record represents an observation at a station at a given point in time, so if you plot these “as is” the likely idea is you’re making an illustrated time series of some sort, as you’ll have tons of observations plotted on a few spots (where the stations are). If this isn’t desirable, then you’ll filter records to create extracts for just a given point in time, maybe separate features for each time period. For monthly summaries you can pivot time to columns, to create a column for each month and indicator. This would be impractical for daily or hourly summaries, unless you’re focusing on a single month for the former or day / week for the latter (otherwise you’ll have a bazillion columns).
Annoyingly, the CSV option doesn’t include any of the station information in the download (like the standard WBAN ID, name, longitude, latitude, and elevation) except for one unique identifier. I know that this information was all included in the past, and am not sure why it was dropped. The TXT version includes the station info, but fixed-width files are a pain to work with. If you are working with a small number of stations, you can pull the station info individually by previewing the station on the download screen (click on the station title or little eye symbol). The five digit WBAN number is included as the last 5 digits of the identifier in the CSV, so you can identify and relate each one. If you don’t want to mess with copying and pasting, you can generate a second extract for all the stations for just a single day and download that in the TXT format, and then parse just the station columns and associate them with your main table.
There are multiple ways that you can create extracts for this data beyond the example I just provided, available from the main data tools page. For a more refined search you can select the summary period (yearly, monthly, daily, hourly) and targeted variables in advance. There are also FTP options for bulk downloads.
One thing that surprises folks who are new to working with this data, is that there aren’t many weather stations. For the LCD, my home state of Delaware only has three, one in each county. The entire City of New York only has three as well, at each of the airports and one in Central Park. If you’re not interested in points and want areas, then you would need to gather a significant number of stations and do interpolation. Or – use data that’s already modeled. I mentioned PRISM at Oregon State in a previous post, as a nice source for national US rasters of temperature and precipitation that you can generate for dailies, monthlies, and normals.
