announcements

Specifically for meta-information about the site

USAID DHS No Data Available

Rescuing US Government Data

There’s been a lot of turmoil emanating from Washington DC lately. One development that’s been more under the radar than others has been the modification or removal of US federal government datasets from the internet (for some news, see these articles in the New Yorker, Salon, Forbes, and CEN). In some cases, this is the intentional scrubbing or deletion of datasets that focus on topics the current administration doesn’t particularly like, such as climate and public health. In other cases, the dismemberment of agencies and bureaus makes data unavailable, as there’s no one left to maintain or administer it. While most government data is still available via functioning portals, most of the faculty and researchers I work with can identify at least a few series they rely on that have disappeared.

Librarians, archivists, researchers, professors, and non-profits across the country (and even in other parts of the world), have established rescue projects, where they are actively downloading and saving data in repositories. I’ve been participating in these efforts since January, and will outline some of the initiatives in this post.

The Internet Archive

The place of last resort for finding deleted web content is the Internet Archive. This large, non-profit project has been around as long as the web has existed, with the goal of creating a historic archive of the internet. It uses web crawlers or spiders to creep across the web and make copies of websites. With the Wayback Machine, you can enter a URL and find previous copies of web pages, including sites that no longer exist. You’re presented with a calendar page where you can scroll by year and month to select a date when a page was captured, which opens up a copy.
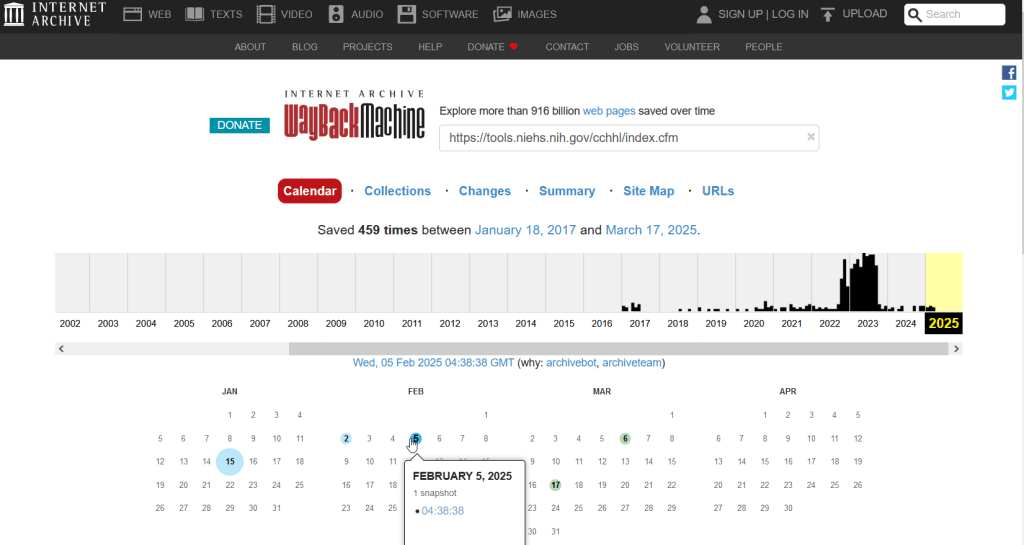
A Wayback Machine search for https://tools.niehs.nih.gov/cchhl/index.cfm. Blue circles on the calendar indicate when the page was captured.

This allows you to see the content, navigate through the old website, and in many cases download files that were stored on those pages. It’s a great resource, but it can’t capture everything; given the variety and complexity of web pages and evolving web technologies, some websites can’t be saved in working order (either partially or entirely). Content that was generated and presented dynamically with JavaScript, or was pulled and presented from a database, is often not preserved, as are restricted pages that required log-ins.

An archived copy of the NIEHS page (the actual website was deleted in mid February 2025)

The Internet Archive also hosts a number of special collections where folks have saved documents, images, sound and video, and software. For example, you can find many research articles that are available in PubMed from the PubMed Central collection, a ton of documents from the USDA’s National Agricultural Library, and about 100 GB of data someone captured from the CDC in January 2025. A large project called the End of Term Archive was launched in 2008 to capture what federal government websites looked like at the end of each presidential term. The pages are saved in a special collection in the IA.

Data Rescue Project

Dozens of new data archiving projects were launched at the end of 2024 and beginning of 2025 with the intention of saving federal datasets. The Data Rescue Project is one of the larger efforts, which has been driven by data librarians and archivists with non-profit partners. Professional groups including IASSIST, ICPSR, RDAP, the Data Curation Network, and the Safeguarding Research & Culture project have been active organizers and participators. While this will be an oversimplification, I’ll summarize the project as having two goals

The first goal is to keep track of what the other archiving projects are, and what they have saved. To this end, they created the Data Rescue Tracker, which has two modules. The Downloads List is an archive of datasets that have been saved, with details about where the data came from and locations of archived copies. The Maintainers List is a catalog of all the different preservation projects, with links to their home pages. There is also a narrative page with a comprehensive list of links to the various rescue efforts, data repositories, alternate sources for government data, and tools and resources you can use to save and archive data.
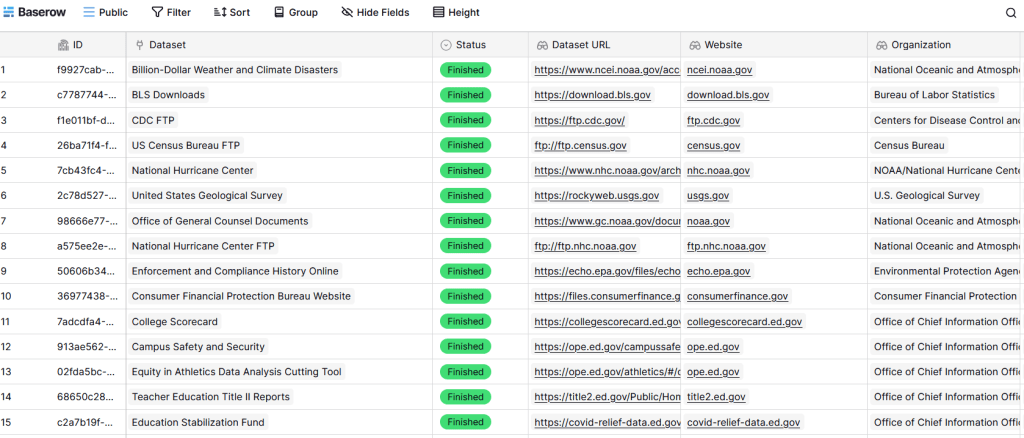
The Data Rescue Tracker Downloads List

The second goal is to contribute to the effort of saving and archiving data. The team maintains an online spreadsheet with tabs for agencies that contain lists of datasets and URLs that are currently prioritized for saving. Volunteers sign up for a dataset, and then go out and get it. Some folks are manually downloading and saving files (pointing and clicking), while others write short screen scraping scripts to automate the process. The Data Rescue Project has partnered with ICPSR, a preeminent social science research center and repository in the US, at the University of Michigan. They created a repository called DataLumos, which was launched specifically for hosting extracts of US federal government data. Once data is captured, volunteers organize it and generate metadata records prior to submitting it to DataLumos (provided that the datasets are not too big).
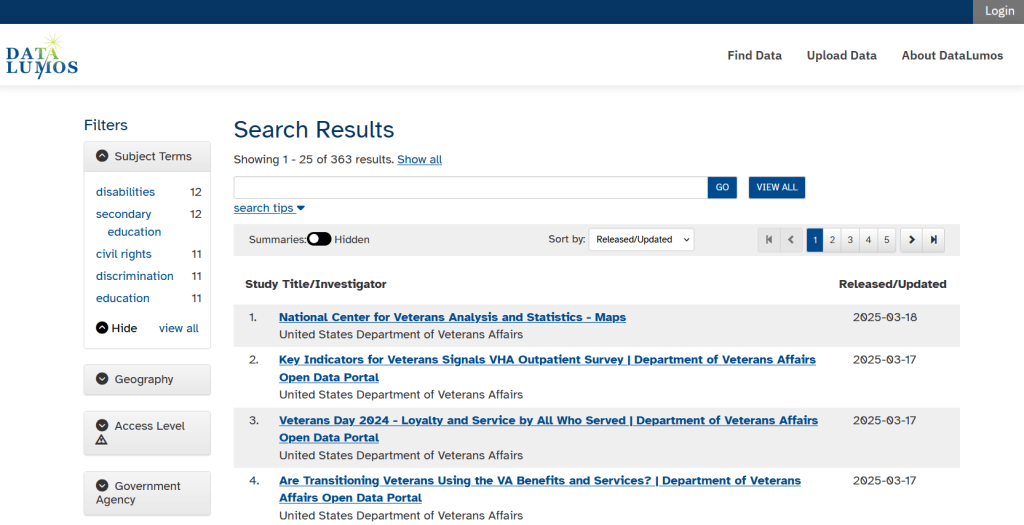
DataLumos archive for federal government datasets, maintained by ICPSR

Most of the datasets that DRP is focused on are related to the social sciences and public policy. The Data Rescue Project coordinates with the Environmental and Government Data Initiative and the Public Environmental Data Partners (which I believe are driven by non-profit and academic partners), who are saving data related to the environment and health. They have their own workflows and internal tracking spreadsheets, and are archiving datasets in various places depending on how large they are. Data may be submitted to the Internet Archive, the Harvard Dataverse, GitHub, SciOp, and Zenodo (you can find out where in the Data Rescue Tracker Download’s List).

Mega Projects

There are different approaches for tackling these data preservation efforts. For the Data Rescue Project and related efforts, it’s like attacking the problem with millions of ants. Individual people are coordinating with one another in thousands of manual and semi-automated download efforts. A different approach would be to attack the problem with a small herd of elephants, who can employ larger resources and an automated approach.

For example, the Harvard Law School Library Innovation Lab launched the Archive of data.gov, a large project to crawl and download everything that’s in data.gov, the US federal government’s centralized data repository. It mirrors all the data files stored there and is updated regularly. The benefit of this approach is that it captures a comprehensive amount of data in one go, and can be readily updated. The primary limitation is that there are many cases where a dataset is not actually stored in data.gov, but is referenced in a catalog record with a link that goes out to a specific agency’s website. These datasets are not captured with this approach.

If trying to find back-ups is a bit bewildering, there’s a tool that can help. Boston University’s School of Public Health and Center for Health Data Science have created a find lost* data search engine, which crawls across the Harvard Project, DataLumos, the Data Rescue Project, and others.

Beyond the immediate data preservation projects that have sprung up recently, there are a number of large, on-going projects that serve as repositories for current and historical datasets. Some, like IPUMS at the University of Minnesota and the Election Lab at MIT focus on specific datasets (census data for the former, election results data for the latter). There are also more heterogeneous repositories like ICPSR (including OpenICPSR which doesn’t require a subscription), and university-based repositories like the Harvard Dataverse (which includes some special collections of federal data extracts, like CAFE). There are also private-sector partners that have an equal stake in preserving and providing access to government data, including PolicyMap and the Social Explorer.

Wrap-up

I’ve been practicing my Python screen scraping skills these past few months, and will share some tips in a subsequent post. I’ve been busy contributing data to these projects and coordinating a response on my campus. We’ve created a short list of data archives and alternative sources, which captures many of the sources I’ve mentioned here plus a few others. My library colleagues in the health and medical sciences have created a list of alternatives to government medical databases including PubMed and ClinicalTrials.gov

Having access to a public and robust federal statistical system is a non-partisan issue that we should all be concerned about. Our Constitution justifies (in several sections) that we should have such a system, and we have a large body of federal laws that require it. Like many other public goods, the federal statistical system contributes to providing a solid foundation on which our society and economy rest, and helps drive innovation in business, policy, science, and medicine. It’s up to us to protect and preserve it.
End of Year Reflections

I’ve missed my once-a-month goal for writing posts several times this year. This is partially for good reasons, as I’ve been busy supporting students and faculty with coursework and projects, and have been supervising the excellent work of my own students in the lab. We’ve made great progress, releasing a spatial database for Rhode Island mapping projects, writing new tutorials, inventorying thousands of USGS topo maps, and supporting hundreds of students and faculty with their geospatial and demographic research.

But in order to effectively support the work of others, academic librarians need to have a research agenda of their own; to keep up with evolving technology and scholarship to remain effective, and to sustain your own intellectual interests as a professional. Which brings us to the bad reasons behind my posting inactivity. My professional development has come to a screeching halt since I began my new position three years ago. My employer is adverse to supporting scholarly activities for professional librarians (although they gladly share credit if you do the work on evenings, weekends, and vacation time), and a heavy workload makes it impossible to find time for professional development. There are many reasons behind this for which I can’t go into detail – I’ll generally say that bad management and an over-sized library managerial caste are the primary culprits.

Unfortunately this is all too common in academic librarianship. Some high-profile articles have discussed this recently, surveys show that morale is low, and there’s a small but budding branch of scholarship that focuses on library dysfunction. It’s a shame, because both traditional “core-research” librarians and data services-oriented librarians play vital roles within higher ed, and there is no shortage of students and professors who remind me of this on a regular basis. In my opinion, while many students and professors understand and value the work of librarians, many library administrators do not. They dismiss traditional subject librarians as legacy service providers, and they completely do not understand the work of data librarians.

I’ve heard several depressing stories from colleagues at other schools who have been undermined, shuffled around, and in some cases put out of business by incompetent leadership within their library. Within GIS and data librarianship I know several folks who have given up, leaving higher ed for the private sector or independent consulting.

Towards the end of the semester, as I was finishing an hour-long GIS consultation with a grateful undergrad, he asked me what research projects I was currently working on, and what kind of research I do. I was embarrassed to admit that I haven’t been working on anything of my own. After having written a book and publishing several well-received reports, I’m doing nothing more than the intellectual equivalent of shoveling snow. I can’t help but think that I’ve taken a wrong turn, and as the new year begins it’s time to consider the options: focus more sharply on the positive aspects of my position while minimizing the negatives? And somehow, carve out time to do work that I’m interested in? Or, consider moving on, being mindful to avoid exchanging one set of bad circumstances with another? For the latter, this may mean leaving academic librarianship behind.

I am most fortunate in that I don’t have to return to work until the second week of January, and it’s good to have this time to recuperate and reflect. Best wishes to you in the coming new year – Frank

2020 Census Demographic Profile

2020 Census Data Wrap-up

Right before the semester began, I updated the Rhode Island maps on my census research guide so that they link to the recently released Demographic Profile tables from the 2020 Census. I feel like the release of the 2020 census has flown lower on the radar compared to 2010 – it hasn’t made it into the news or social media feeds to the same degree. It has been released much later than usual for a variety of reasons, including the COVID pandemic and political upheaval and shenanigans. At this point in Sept 2023, most of what we can expect has been released, and is available via data.census.gov and the census APIs.

Here are the different series, and what they include.

  • Apportionment data. Released in Apr 2021. Just the total population counts for each state, used to reapportion seats in Congress.
  • Redistricting data. Released in Aug 2021. Also known as PL 91-171 (for the law that requires it), this data is intended for redrawing congressional and legislative districts. It includes just six tables, available for several geographies down to the block level. This was our first detailed glimpse of the count. The dataset contains population counts by race, Hispanic and Latino ethnicity, the 18 and over population, group quarters, and housing unit occupancy. Here are the six US-level tables.
  • Demographic and Housing Characteristics File. Released in May 2023. In the past, this series was called Summary File 1. It is the “primary” decennial census dataset that most people will use, and contains the full range of summary data tables for the 2020 census for practically all census geographies. There are fewer tables overall relative to the 2010 census, and fewer that provide a geographically granular level of detail (ostensibly due to privacy and cost concerns). The Data Table Guide is an Excel spreadsheet that lists every table and the variables they include.
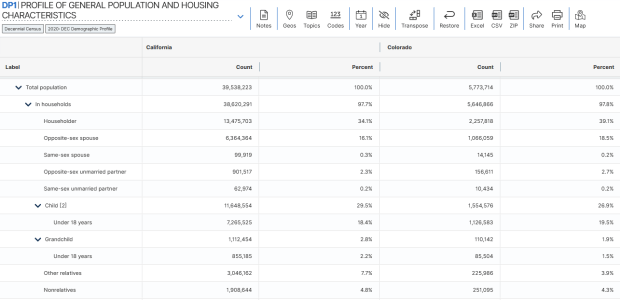
  • Demographic Profile. Released in May 2023. This is a single table, DP1, that provides a broad cross-section of the variables included in the 2020 census. If you want a summary overview, this is the table you’ll consult. It’s an easily accessible option for folks who don’t want or need to compile data from several tables in the DHC. Here is the state-level table for all 50 states plus.
  • Detailed Demographic and Housing Characteristics File A. Released in Sept 2023. In the past, this series was called Summary File 2. It is a subset of the data collected in the DHC that includes more detailed cross-tabulations for race and ethnicity categories, down to the census tract level. It is primarily used by researchers who are specifically studying race, and the multiracial population.
  • Detailed Demographic and Housing Characteristics File B. Not released yet. This will be a subset of the data collected in the DHC that includes more detailed cross-tabulations on household relationships and tenure, down to the census tract level. Primarily of interest to researchers studying these characteristics.

There are a few aspects of the 2020 census data that vary from the past – I’ll link to some NPR stories that provide a good overview. Respondents were able to identify their race or ethnicity at a more granular level. In addition to checking the standard OMB race category boxes, respondents could write in additional details, which the Census Bureau standardized against a list of races, ethnicities, and national origins. This is particularly noteworthy for the Black and White populations, for whom this had not been an option in the recent past. It’s now easier to identify subgroups within these groups, such as Africans and Afro-Caribbeans within the Black population, and Middle Eastern and North Africans (MENA) within the White population. Another major change is that same-sex marriages and partnerships are now explicitly tabulated. In the past, same-sex marriages were all counted as unmarried partners, and instead of having clearly identifiable variables for same-sex partners, researchers had to impute this population from other variables.

Another major change was the implementation of the differential privacy mechanism, which is a complex statistical process to inject noise into the summary data to prevent someone from reverse engineering it to reveal information about individual people (in violation of laws to protect census respondent’s privacy). The social science community has been critical of the application of this procedure, and IPUMS has published research to study possible impacts. One big takeaway is that published block-level population data is less reliable than in the past (housing unit data on the other hand is not impacted, as it is not subjected to the mechanism).

When would you use decennial census data versus other census data? A few considerations – when you:

  • Want or need to work with actual counts rather than estimates
  • Only need basic demographic and housing characteristics
  • Need data that provides detailed cross-tabulations of race, which is not available elsewhere
  • Need a detailed breakdown of the group quarters population, which is not available elsewhere
  • Are explicitly working with voting and redistricting
  • Are making historical comparisons relative to previous 10-year censuses

In contrast, if you’re looking for detailed socio-economic characteristics of the population, you would need to look elsewhere as the decennial census does not collect this information. The annual American Community Survey or monthly Current Population Survey would be likely alternatives. If you need basic, annual population estimates or are studying the components of population change, the Population and Housing Unit Estimates Program is your best bet.

US Census Data ALA Tech Report

ALA Tech Report on Using Census Data for Research

I have written a new report that’s just been released: US Census Data: Concepts and Applications for Supporting Research, was published as the May / June 2022 issue of the American Library Association’s Library and Technology Reports. It’s available for purchase digitally or in hard copy from the ALA from now through next year. It will also be available via EBSCOhost as full text, sometime this month. One year from now, the online version will transition to become a free and open publication available via the tech report archives.

The report was designed to be a concise primer (about 30 pages) for librarians who want to be knowledgeable with assisting researchers and students with finding, accessing, and using public summary census data, or who want to apply it to their own work as administrators or LIS researchers. But I also wrote it in such a way that it’s relevant for anyone who is interested in learning more about the census. In some respects it’s a good distillation of my “greatest hits”, drawing on work from my book, technical census-related blog posts, and earlier research that used census data to study the distribution of public libraries in the United States.

Chapter Outline

  1. Introduction
  2. Roles of the Census: in American society, the open data landscape, and library settings
  3. Census Concepts: geography, subject categories, tables and universes
  4. Datasets: decennial census, American Community Survey, Population Estimates, Business Establishments
  5. Accessing Data: data.census.gov, API with python, reports and data summaries
  6. GIS, historical research, and microdata: covers these topics plus the Current Population Survey
  7. The Census in Library Applications: overview of the LIS literature on site selection analysis and studying library access and user populations

I’m pleased with how it turned out, and in particular I hope that it will be used by MLIS students in data services and government information courses.

Although… I must express my displeasure with the ALA. The editorial team for the Library Technology Reports was solid. But once I finished the final reviews of the copy edits, I was put on the spot to write a short article for the American Libraries magazine, primarily to promote the report. This was not part of the contract, and I was given little direction and a month at a busy time of the school year to turn it around. I submitted a draft and never heard about it again – until I saw it in the magazine last week. They cut and revised it to focus on a narrow aspect of the census that was not the original premise, and they introduced errors to boot! As a writer I have never had an experience where I haven’t been given the opportunity to review revisions. It’s thoroughly unprofessional, and makes it difficult to defend the traditional editorial process as somehow being more accurate or thorough compared to the web posting and tweeting masses. They were apologetic, and are posting corrections. I was reluctant to contribute to the magazine to begin with, as I have a low opinion of it and think it’s deteriorated in recent years, but that’s a topic for a different discussion.

Stepping off the soapbox… I’ll be attending the ALA annual conference in DC later this month, to participate on a panel that will discuss the 2020 census, and to reconnect with some old colleagues. So if you want to talk about the census, you can buy me some coffee (or beer) and check out the report.

A final research and publication related note – the map that appears at the top of my post on the distribution of US public libraries from several years back has also made it into print. It appears on page 173 of The Argument Toolbox by K.J. Peters, published by Broadview Press. It was selected as an example of using visuals for communicating research findings, making compelling arguments in academic writing, and citing underlying sources to establish credibility. I’m browsing through the complimentary copy I received and it looks excellent. If you’re an academic librarian or a writing center professional and are looking for core research method guides, I would recommend checking it out.

UN ICSC Retail Price Index Map

UN Retail Price Index Time Series

We recently launched our fledgling geodata portal on GitHub for the open datasets we’ll create in our new lab. In the spring we carved out a space on the 11th floor of the Sciences Library at Brown which we’ve christened GeoData@SciLi, a GIS and data consultation and work space. We’ll be doing renovations on both the webspace and workspace over the summer.

Our inaugural dataset was created by Ethan McIntosh, a senior (now graduate) who began working with me this spring. The dataset is the United Nations International Civil Service Commission’s (UN ICSC) Retail Price Indices with Details (RPID). The index measures the cost of living based on several categories of goods and services in duty stations around the world. It’s used to adjust the salaries of the UN’s international staff relative to UN headquarters in New York City (index value of 100 = cost of living in New York). The data is updated six times a year, published in an Excel spreadsheet that contains a macro that allows you to look up the value of each duty station via a dropdown menu. The UN ICSC makes the data public by request; you register and are granted access to download the data in PDF and Excel format in files that are packaged in one month / year at a time.

We were working with a PhD student in economics who wanted to construct a time-series of this data. Ethan wrote a Python script to aggregate all of the files from 2004 to present into a single CSV; the actual values for each country / duty station were stored in hidden cells that the macro pulled from, and he was able to pull them from these cells. He parsed the data into logical divisions, and added the standard 3-letter ISO 3166 country code to each duty station so that each record now has a unique place identifier. His script generates three outputs: a basic CSV of the data in separate month / year files, a “long” (aka flat) time series file where each record represents a specific duty station and retail index category or weight for a given month and year, and a “wide” time series file where the category / weight has been pivoted to a column, so each record represents all values for a duty station for a given month / year. He’s written the program to process and incorporate additional files as they’re published.

While the primary intention was to study this data as a time series in a statistical analysis, it can also be used for geospatial analysis and mapping. Using the wide file, I created the map in the header of this post, which depicts the total retail index for February 2022 for each country, where the value represents the duty station within the country (usually the capital city). I grabbed some boundaries from Natural Earth and joined the data to it using the ISO code. I classified the data using natural breaks, but manually adjusted the top level category to include all countries with a value greater than or equal to the base value of 100.

There were only five duty stations that were more expensive than New York, with values between 102 and 124: Tokyo, Ashkhabad (Turkmenistan), Singapore, Beirut, and Hong Kong. Beijing and Geneva were equivalent in price at 100. The least expensive stations with values between 52 and 69 were: Caracas (Venezuela), Tripoli, Damascus, Ankara (Turkey), Bucharest (Romania), Mbabane (Eswatini – formerly Swaziland), and Sofia (Bulgaria). There appears to be regional clustering of like values, although I didn’t run any tests. The station in the US that’s measured relative to NYC is Washington DC (index value of 89).

The final datasets and code used to generate them are available on GitHub, and we’ll update it at least once, if not a couple times, a year. We are not providing the original month / year macro spreadsheets; if you want those you should register with the UN ICSC and access them there. If you’re using our data files, you should still register with them, as they would like to be aware of how their data is being used.

We will post additional projects, datasets, and code in individual repos as we create them, linked to from our main page. I’m working on creating a basic metadata profile for our lab, so we’ll provide structured metadata for each of our datasets in the near future.

Census ACS 2020 and Pop Estimates 2021

Last week, the Census Bureau released the latest 5-year estimates for the American Community Survey for 2016-2020. This latest dataset uses the new 2020 census geography, which means if you’re focused on using the latest data, you can finally move away from the 2010-based geography which had been used for the ACS from 2010 to 2019 (with some caveats: 2020 ZCTAs won’t be utilized until the 2021 ACS, and 2020 PUMAs until 2022). As always, mappers have a choice between the TIGER Line files that depict the precise boundaries, or the generalized cartographic boundary files with smoothed lines and large sections of coastal water bodies removed to depict land areas. The 2016-2020 ACS data is available via data.census.gov and the ACS API.

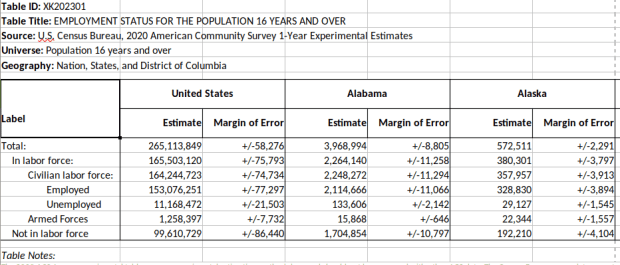
This release is over 3 months late (compared to normal), and there was some speculation as to whether it would be released at all. The pandemic (chief among several other disruptive events) hampered 2020 decennial census and ACS operations. The 1-year 2020 ACS numbers were released over 2 months later than usual, in late November 2021, and were labeled as an experimental release. Instead of the usual 1,500 plus tables in 40 subject areas for all geographic areas with over 65,000 people, only 54 tables were released for the 50 states plus DC. This release is only available from the experimental tables page and is not being published via data.census.gov.

What happened? The details were published in a working paper, but in summary fewer addresses were sampled and the normal mail out and follow-up procedures were disrupted (pg 8). The overall sample size fell from 3.5 to 2.9 million addresses due to reduced mailing between April and June 2020 (pg 18), and total interviews fell from 2 million to 1.4 million with most of the reductions occurring in spring and summer (pg 18). The overall housing unit response rate for 2020 was 71%, down from 86% in 2019 and 92% in 2018 (pg 20). The response rate for the group quarters population fell from 91% in 2019 to 47% in 2020 (pg 21). Responses were differential, varying by time period (with the lowest rates during the peak pandemic months) and geography. Of the 818 counties that meet the 65k threshold, response rates in some were below 50% (pg 21). The data contained a large degree of non-response bias, where people who did respond to the survey had significantly different social, economic and housing characteristics from those who didn’t. As a consequence of all of this, margins of error for the data increased by 20 to 30% over normal (pg 18).

Thus, 2020 will represent a hole in the ACS estimates series. The Bureau made adjustments to weighting mechanisms to produce the experimental 1-year estimates, but is generally advising policy makers and researchers who normally use this series to choose alternatives: either the 1-year 2019 ACS, or the 5-year 2016-2020 ACS. The Bureau was able to make adjustments to produce satisfactory 5-year estimates to reduce non-response bias, and the 5-year pool of samples is balanced somewhat by having at least 4 years of good data.

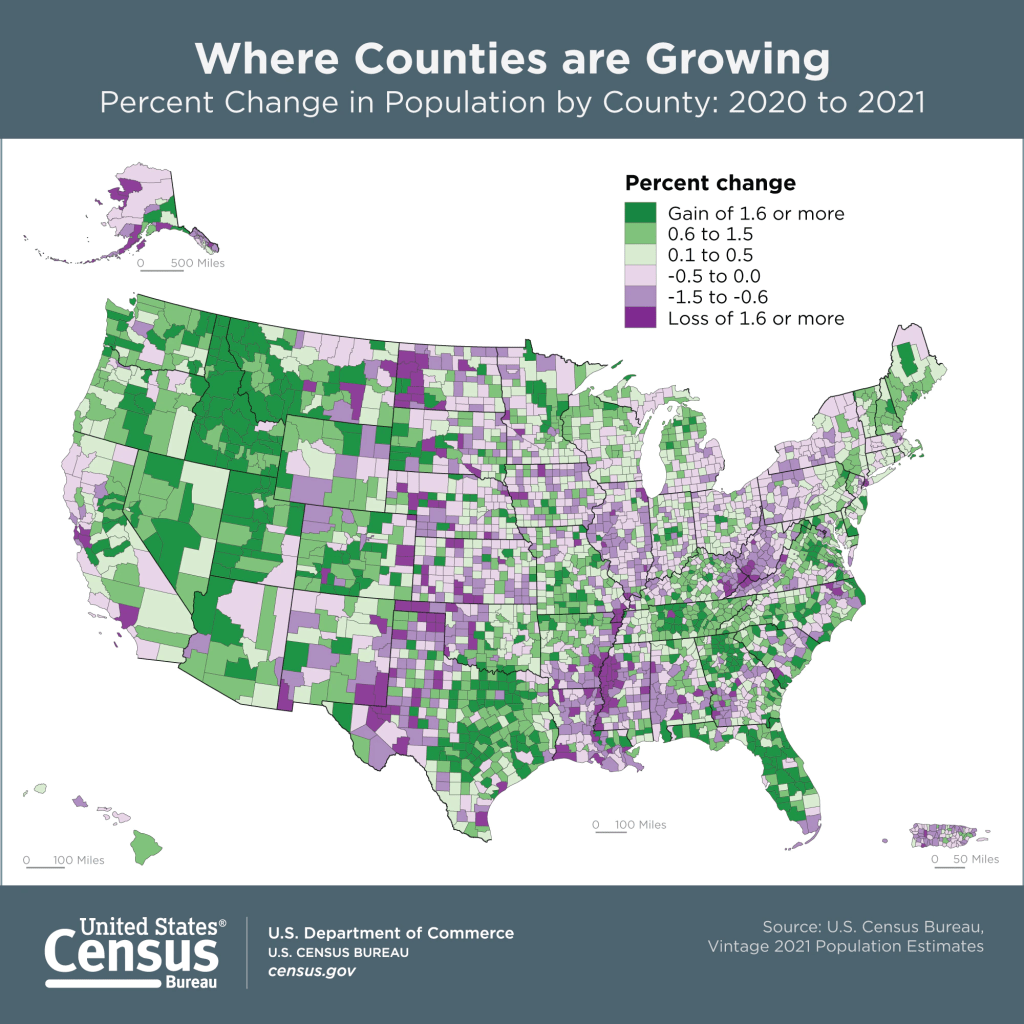
The Population Estimates Program has also released its latest series of vintage 2021 estimates for counties and metropolitan areas. This dataset gives us a pretty sharp view of how the pandemic affected the nation’s population. Approximately 73% of all counties experienced natural decrease in 2021 (between July 1st 2020 and 2021), where the number of deaths outnumbered births. In contrast, 56% of counties had natural decrease in 2020 and 46% in 2019. Declining birth rates and increasing death rates are long term trends, but COVID-19 magnified them, given the large number of excess deaths on one hand and families postponing child birth due to the virus on the other hand. Net foreign migration continued its years-long decline, but net domestic migration increased in a number of places, reflecting pandemic moves. Medium to small counties benefited most, as did large counties in the Sunbelt and Mountain West. The biggest losers in overall population were counties in California (Los Angeles, San Francisco, and Alameda), Cook County (Chicago), and the counties that constitute the boroughs of NYC.

Census Bureau 2021 Population Estimates Map