I’ve also received a number of questions this semester about animal observation and tracking data. Since I usually study people and not animals, I was a bit out of my element and had some homework to do. If you’ve ever watched nature shows, you’ve seen scientists tagging animals with collars or bands to track them by radio or satellite, or setting up cameras to record them. Many scientists upload their GPS coordinate data into publicly accessible repositories for others to download and use.
I’ve written a short, three-part document that I’ve posted on our tutorials page: GIS Data Sources for Wildlife Tutorial. In the first part, I provide summaries, links, and guidance on using large portals like Movebank and Zoatrack* that include many species from all over the world (wild and domestic), as well a government repositories including NOAA’s National Center for Environment Information Geoportal and the National Park Service’s Data Store. The second part focuses on search strategies, crawling the web and combing through academic literature in library databases to find additional data. Since these datasets are highly diffuse, it’s worth going beyond the portals to see what else you can discover.
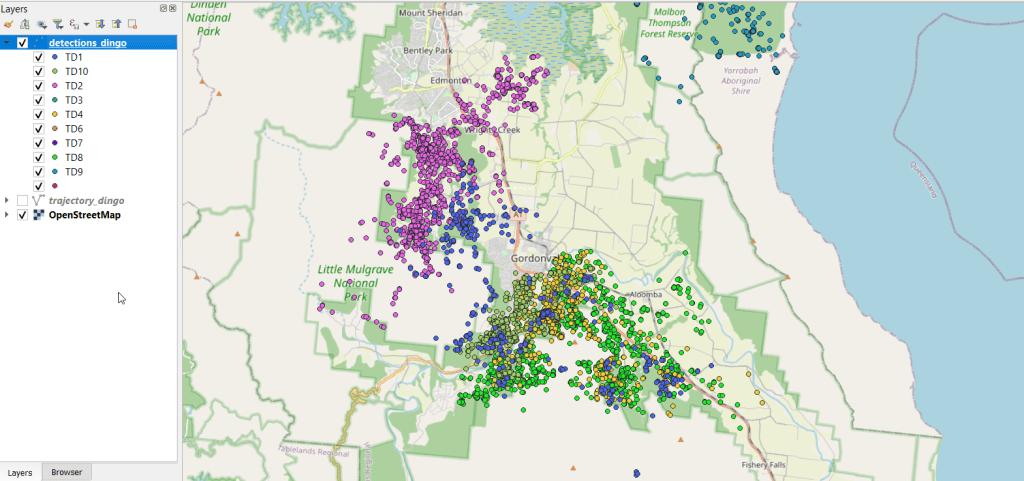
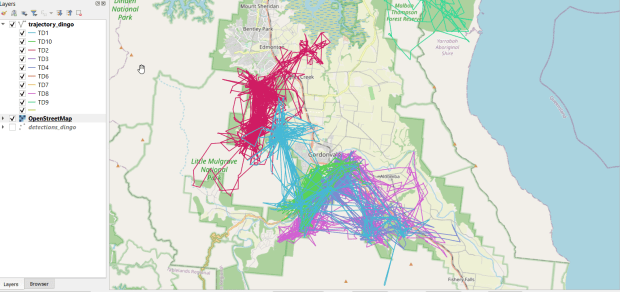
I describe how you can add and visualize this data in QGIS and ArcGIS Pro in the third and final part. Wildlife data comes packaged in a number of formats; in some cases you’ll find shapefiles or geodatabases that you can readily add and visualize, but more often than not the data is packaged in a plain CSV / TXT format. This requires you to plot the coordinates (X for longitude, Y for latitude) to create a dot map of the observations. Data files will often contain a number of individual animals, which can be uniquely identified with a tag ID, allowing you to symbolize the points by category so you have a different color or symbol for each individual. Alternatively, there might be separate data files for each individual, that you could add and symbolize differently. The files will contain either a sequential integer or a timestamp that indicates the order of the observations. With one field that indicates the order and another that identifies each individual, you can use a Points to Line or Points to Path tool to generate lines (tracks or trajectories) from the points (observations or detections).
You can see where dingos in Queensland, Australia are going in the screenshot below, which displays individual observation points, and the screenshot in the header of this post where the points were connected to form paths. I obtained the data from ZoaTrack and used QGIS for mapping. Check out the tutorial for details on how to find and map your favorite animals.
* NOTE: ZoaTrack went offline in July 2024. You can still access an archive of the site and its datasets via the Internet Archive’s Wayback Machine. Here is a cached version of Zoatrack from June 2024. The tutorial will be updated to reflect this change soon.