The staff at the Population Division at NYC City Planning take the limitations of the American Community Survey (ACS) data seriously. Census estimates for tract-level data tend to be unreliable; to counter this, they aggregate tracts into larger Neighborhood Tabulation Areas (NTAs) to produce estimates that have better precision. In their Census Factfinder tool, they display but grey-out variables where the margin of error (MOE) is unacceptably large. If users want to aggregate geographies, the Factfinder does the work of re-computing the margins of error.
Now they’ve released a new tool for census mappers. The Map Reliability Calculator is an Excel spreadsheet for measuring the reliability of classification schemes for making choropleth maps. Because each ACS estimate is published with a MOE, it’s possible that certain estimates may fall outside their designated classification range.
For example, we’re 90% confident that 60.5% plus or minus 1.5% of resident workers 16 years and older in Forest Hills, Queens took public transit to work during 2011-2015. The actual value could be as low as 59% or as high as 62%. Now let’s say we have a classification scheme that has a class with a range from 60% to 80%. Forest Hills would be placed in this class since its estimate is 60.5%, but it’s possible that it could fall into the class below it given the range of the margin of error (as the value could be as low as 59%).
The tool determines how good your classification scheme is by calculating the percent of estimates that could fall outside their assigned class, based on each MOE and the break point of the class. On the left of the sheet you paste your estimates and MOEs, and then type the number of classes you want. On the right, the reliability of classifying that data is calculated for equal intervals (equal range of values in each class) and quantiles (equal number of data points in each class). You can see the reliability of each class and the overall reliability of the scheme. The scheme is classified as reliable if: no individual class has more than 20% of its values identified as possibly falling outside the class, and less than 10% of all the scheme’s values possibly fall outside their classes.
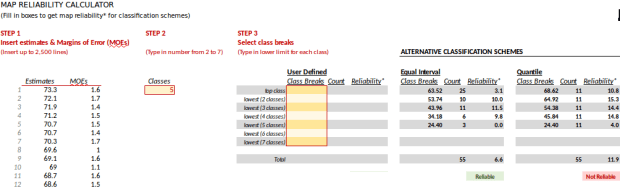
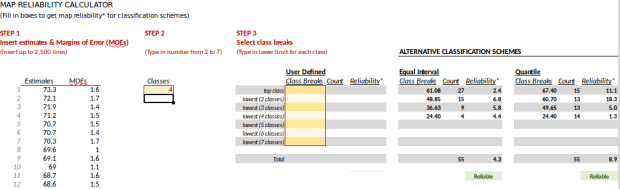
I pasted some 5-year ACS data for NYC PUMAs below (the percentage of workers 16 years and older who take public transit to work in 2011-2015) under STEP 1. In STEP 2 I entered 5 for the number of classes. In the classification schemes on the right, equal intervals is reliable; only 6.6% of the values may fall outside their class. Quantiles was not reliable; 11.9% fell outside. If I reduce the number of classes to 4, reliability improves and both schemes fall under 10%; although unreliability for one of the classes for quantiles is high at 18%, but still below the 20% threshold. Equal intervals should usually perform better than quantiles, as the latter scheme can make rather arbitrary breaks that result in small differences in value ranges between classes (in order to insure that each class has the same number of data points).
You can also enter custom-defined schemes. For example let’s say you use natural breaks (classes determined by gaps in value ranges). There’s a 2-step process here; first you classify the data in GIS and determine what the breaks are, and then you enter them in the spreadsheet. If you’re using QGIS there’s a snag in doing this; QGIS doesn’t show you the “true” breaks of your data based on the actual values, and when you classify data it displays clean breaks that overlap. For example, natural breaks of this data with 5 classes appears like this:
24.4 – 29.0
29.0 – 45.9
45.9 – 55.8
55.8 – 65.1
65.1 – 73.3
So, does the value for 29.0 fall in the first class or the second? The answer is, the first (test it by selecting that record in the attribute table and see where it is on the map, and what color it is). So you need to adjust the values appropriately, paying attention to the precision and scale of your numbers. In this case I bump the first value of each class up by .1, except for the bottom class which you leave alone:
24.4 – 29.0
29.1 – 45.9
46.0 – 55.8
55.9 – 65.1
65.2 – 73.3
In the calculator you have to enter the top class value first, and just the first value in the range:
65.2
55.9
46.0
29.1
29.4

In this case only 7.1% of the total values may fall outside their class so things look good – but my bottom class barely makes the minimum class threshold at 19.4%. I can try dropping the classes down to 4 or I can manually adjust this class to see if I can improve reliability.
If you’re unsure if you made the right adjustments to the classes in translating them from QGIS to the calculator, in QGIS turn on the Show Feature Count option for the layer to see how many data points are in each class, and compare that to the class counts in the calculator. If they don’t match, you need to re-adjust.

This is a great tool for census mappers who want or need to account for issues with ACS reliability. It’s an Excel spreadsheet but I used it in LibreOffice Calc with no problem. In addition to the calculator sheet there’s a second sheet with instructions and background info. Download the Map Reliability Calculator here. You can try it out with this test data, workers who commute with mass transit, 2011-2015 ACS for NYC PUMAs.
