
I had lists of businesses that I queried from a large table and saved in individual views in SQLite, where each view contained related businesses based on their industrial classification code (NAICS). There were about 8,000 records in total. Another team needed to review these records and verify whether we needed to keep them in the study or not. The simplest approach was to segment the businesses based on activity, grab a subset of the necessary columns from the main table into a SQL view, and export them to individual Google Sheets so that everyone could access and edit the files. When they were finished, I had to re-aggregate the sheets and get them back into the database, to use a filter for records to keep. I wrote two python / pandas scripts for doing this, which I’ll walk through here.
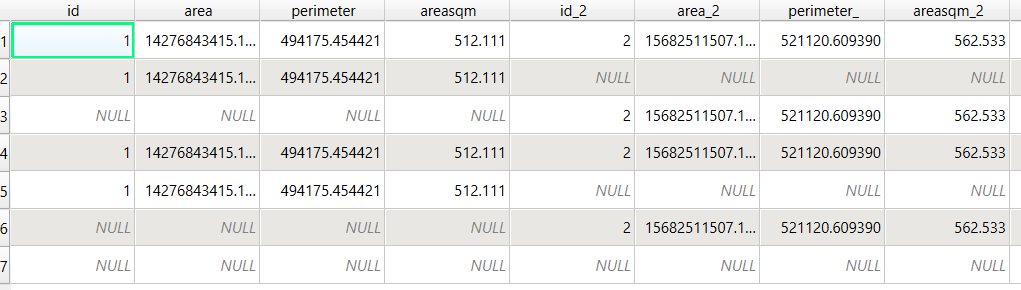
Since I had already written and saved SQL views in the database (see sample image in the post’s header), I wanted to simply access those using pandas, rather than having to write the queries all over again in pandas. My solution is below. At the top I establish variables that specify file names and paths using the os module. I have an Excel file that will serve as my template; it contains one metadata README sheet that will be the same each year. Next, I create a list of the views, plus a list of new columns that I want to add to each sheet that the team will use for verifying the records. Since this is a process I will need to run each year, I provide the year as a variable and insert it into the output files and the view names rather than hard coding it. For example, ‘convenience_stores’ is formatted to ‘v_2023_convenience_stores’ to retrieve the current view from the database.
The work happens in the loop. I iterate through the list of views, and build a query string where I insert the view name. I use pandas.read_sql to execute a SELECT statement, and the result is saved in a dataframe; the result is essentially the result of the view when its executed. Then I iterate through a list of new columns that the reviewers will use, inserting them one by one. They will appear at the front of the worksheet, in the reverse order in which they appear in the list. I use pandas.ExcelWriter and the append mode so I can insert multiple sheets into the workbook template. And that’s it!
import sqlite3, os, pandas as pd

# CHANGE THE YEAR VARIABLE to reflect year we are processing
year='2022' # must be a string - quote!
outfolder='yr{}'.format(year)
vsuffix='v_{}_'.format(year)
outfile='business_lists_{}.xlsx'.format(year)

outpath=os.path.join('business_output',outfolder,outfile)
con = sqlite3.connect('project_db.sqlite')

# views within the database that contain business lists
views=['convenience_stores','department_stores','drinking_places',
       'food_manufacturing', 'gas_stations', 'grocery_stores',
       'liquor_stores','pharmacies','restaurants',
       'specialty_food_stores', 'variety_stores','wholesale_clubs']

# blank columns to insert in each sheet to hold verification
newcols=['notes','maps_verified','recategorize','remove']

for v in views:
    vname=vsuffix+v # creates the actual name of the view in the db
    query='SELECT * FROM {}'.format(vname)
    df=pd.read_sql(query, con)
    for n in newcols:
        df.insert(0,n,'')
    with pd.ExcelWriter(outpath, mode='a') as writer:
        df.to_excel(writer, sheet_name=v, index=False)
    print('Wrote',v,'to output')

print('Done')
con.close()
The final step is to upload the Excel workbook into Google Sheets, and then manually apply some formatting. I looked at some options for writing to Google Sheets directly and skipping Excel as an intermediary, but decided that it looked like more trouble than it was worth. You can’t trust that Google isn’t going to suddenly change something without notice, so this intermediary approach seemed safer.
Once the records have been verified, I needed to combine these sheets into one file and get them back into the database again, where I can use the results to filter the original business table and pull the records we want to keep. My solution for this part is below.
First, I download the finished Google spreadsheet as an Excel file, and provide that as input. Again, I set up input and output paths at the top. I use pandas.read_excel to read the sheets into a dictionary, where the key is the name of the sheet and the value is a dataframe that contains everything in that sheet. I loop through the dictionary, skip the metadata README sheet, and create a list of the dataframes where I add the name of the sheet as a dedicated column. Next, I compare the column names and number of columns in the first dataframe / sheet to each of the others to ensure they are the same in terms or order, name, and number. Lastly, I concatenate all the sheets into one and write them out to a CSV file.
import os, csv, pandas as pd

# CHANGE THE YEAR VARIABLE to reflect year we are processing
year='2022' # must be a string - quote!
folder='yr{}'.format(year)
infile='business_lists_{}.xlsx'.format(year)
outfile='checked_biz_{}.csv'.format(year)

inpath=os.path.join(folder,infile)
outpath=os.path.join(folder,outfile)

# Read sheets to dict, key sheet name and value df
# read all vals as strings to preserve ID codes
sheets_dict = pd.read_excel(inpath, sheet_name=None, dtype=str)

all_sheets_dfs = [] # a list of dataframes, one df per worksheet
for name, sheet in sheets_dict.items():
    if name !='README': # don't include the readme sheet
        sheet['biz_category'] = name # add the sheet name to the data
        all_sheets_dfs.append(sheet)

# This block checks number of columns and names of all sheets against the first one
f=all_sheets_dfs[0]
for i,s in enumerate(all_sheets_dfs):
    check_cols = (s.columns == f.columns).all() and s.shape[1] == f.shape[1]
    if check_cols is False:
        print('Warning: difference in column names or number between first worksheet and number:',i)
    else:
        pass

# Block creates single dataframe of all records and writes to CSV
biz_df = pd.concat(all_sheets_dfs)
biz_df.reset_index(inplace=True, drop=True)
biz_df.to_csv(outpath, index=True, index_label='pid')

print('Done, record count:',len(biz_df))
With that, I can launch the database (using the DB Browser for SQLite), import that CSV to a table, and proceed to join it back to my original table and filter. Alternatively, I could have written the concatenated dataframe directly into the database, but in a pinch this works fine. It’s been a hectic semester and as soon as I get something working I polish it off and move on to the next thing…


You must be logged in to post a comment.