In this post, I’ll demonstrate how to access and download multiple decades of annual population data for US states, counties, and metropolitan areas in a single table. Last semester, I was helping a student in a GIS course find data on tuberculosis cases by state and metro area that stretched back several decades. In order to make meaningful comparisons, we needed to calculate rates, which meant finding an annual time series for total population. Using data directly from the Census Bureau is tough going, as they don’t focus on time series and you’d have to stitch together several decades of population estimates. Metropolitan areas add more complexity, as they are modified at least a few times each decade.
In searching for alternatives, I landed at the Bureau of Economic Analysis (BEA). As part of their charge is studying the economy over time, they gather data from the Census Bureau, Bureau of Labor Statistics, and others to build time series, and they update them as geography and industrial classification schemes change. They publish national, state, metropolitan area, and county-level GDP, employment, income, wage, and population tables that span multiple decades. Their economic profile table for metros and counties covers 1969 to present, while the state profile table goes back to 1958. Metropolitan areas are aggregates of counties. As metro boundaries change, the BEA normalizes the data, adjusting the series by taking older county-level data and molding it to fit the most recent metro definitions.
Finding the population data was a bit tricky, as it is embedded as one variable in the Economic Profile table (identified as CAINC30) that includes multiple indicators. Here’s the path to get it:
- From the BEA website, choose Tools – Interactive Data.
- From the options on the next page, choose Regional from the National, Industry, International or Regional data options. There’s also a link to a video that illustrates how to use the BEA interactive data tool.
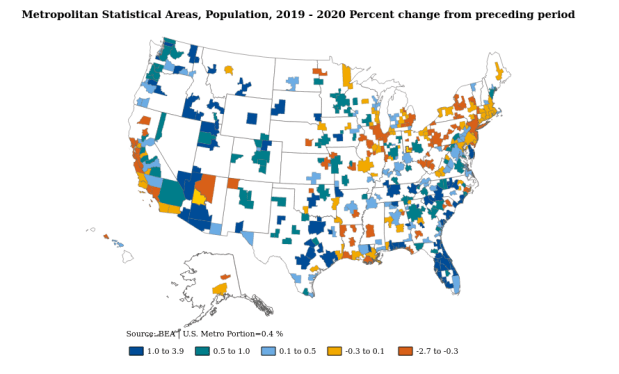
- From the Regional Data page, click “Begin using the data” (but note you can alternatively “Begin mapping the data” to make some basic web maps too, like the one in the header of this post).
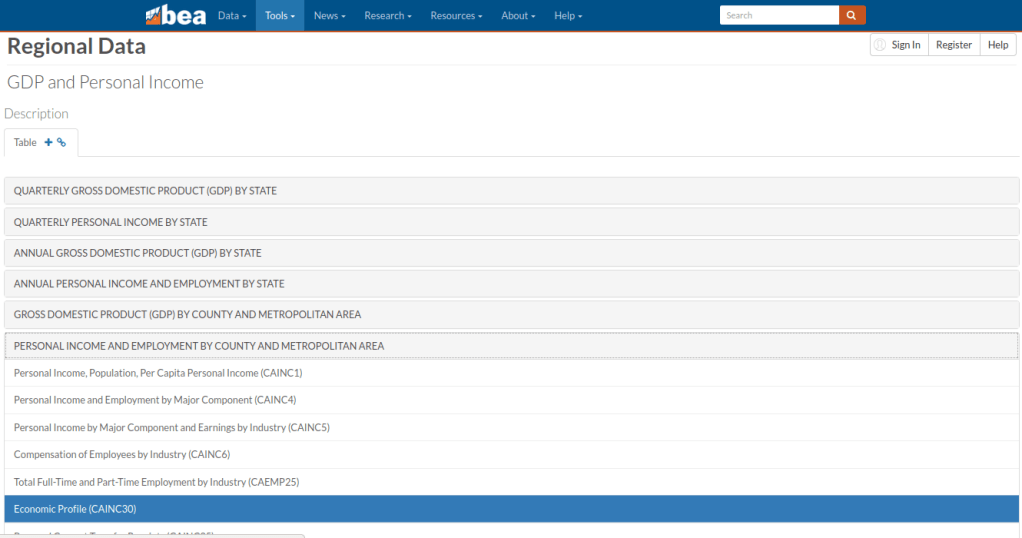
- On the next page are categories, and under each category are data tables for specific series. In this case, Personal Income and Employment by County and Metropolitan Area was what I wanted, and under that the Economic Profile CAINC30 table (states appear under a different heading, but there’s a comparable Economic Profile table for them, SAINC30).
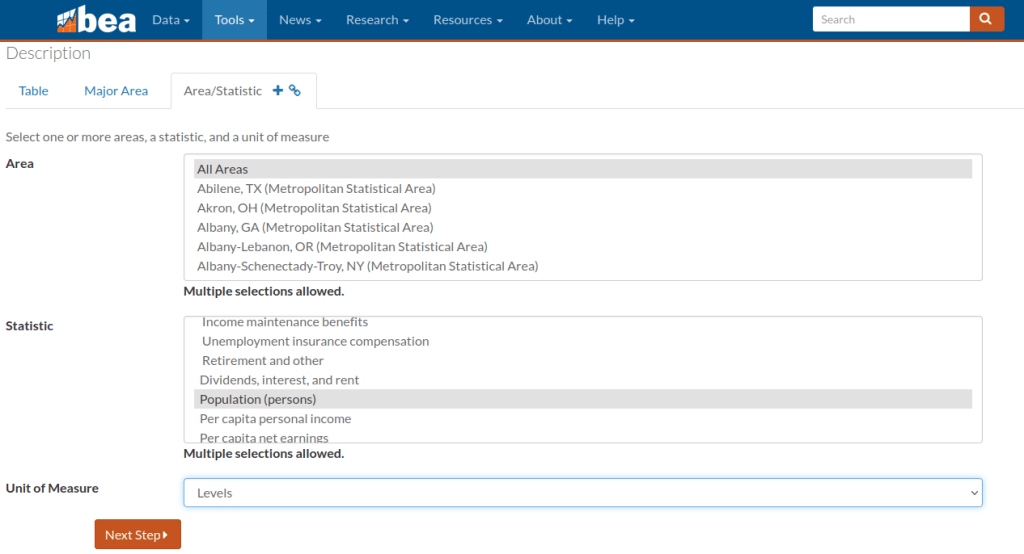
- On the multi-screen table builder, you choose a type of geography (county or different metro area options), and on the next tab you can choose individual places, hold down CTRL and select several, or grab them all with the option at the top of the dropdown. Likewise for the Statistic, choose Population (persons), or grab a selection, or take all the stats. Under the Unit of Measure dropdown, Levels gives you the actual statistic, but you can also choose percent change, index values, and more. On the next tab, choose your years.
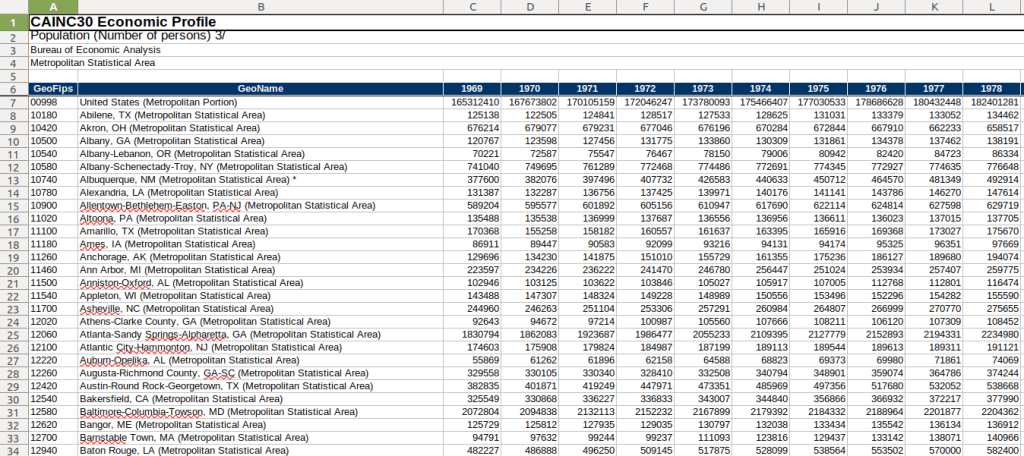
- On the final page, if your selection is small enough you can preview the result and then download. In this case it’s too large, so you’re prompted to grab an Excel or CSV file to download.
And there you have it! One table with 50+ years of annual population data, using current metro boundaries. The footnotes at the bottom of the file indicate that the latest years of population data are based on the most recent vintage estimates from the Census Bureau’s population estimates. Once the final intercensal estimates for the 2010s are released, the data for that decade will be replaced a final time, and the estimates from the 2020s will be updated annually as each new vintage is released until we pass the 2030 census. Their documentation is pretty thorough.
The Interactive Data table approach allows you to assemble your series step by step. If you wanted to skip all the clicking you can grab everything in one download (all years for all places for all stats in a given table). Of course, that means some filtering and cleaning post-download to isolate what you need. There’s also an API, and several other data series and access options to explore. The steps for creating the map that appears at the top of this post were similar to the steps for building the table.
