
June 2019 is the final month that the Census Bureau will post new data in the American Factfinder (AFF). From this point forward, all new datasets will be published via the new data dissemination platform data.census.gov. The second chapter of my book (now available for pre-order!) is devoted to navigating this new interface. In this post I’ll provide a preview / brief tutorial of the advanced search functions.
The new interface is search-driven, so you can type the names of topics and geographies or table ID numbers to find and explore data tables. There are spiffy data profiles for several geographies, and you have the ability to make basic thematic maps. The search interface makes it much easier to casually browse and discover data, so go ahead and explore.
I’d still recommend having a search strategy to find precisely what you need. Keyword searching alone isn’t going to cut it, because you’re searching across tens of thousands of tables in dozens of datasets. The good news is that the same strategy I’ve used for the AFF can be applied to data.census.gov: use the advanced search to filter by survey, year, geography, and topic to narrow down the list of possible tables to a manageable number, and then search or browse through those results to find what you need.
Let’s say we want to download the most recent data on home values for all the counties in Pennsylvania (or a state of your choosing). On data.census.gov click on the advanced search link under the search box. On the advanced search page scroll to the bottom to the filters. We’ll address them one by one:
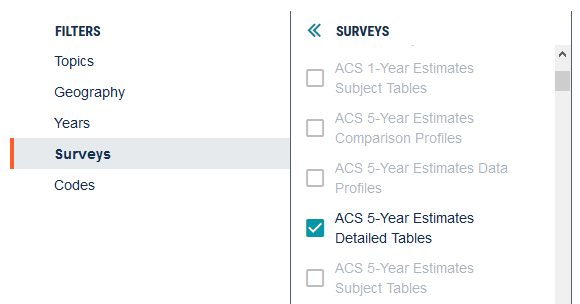
Surveys. These represent all the different census datasets. Select ACS 5-Year Estimates Detailed Tables. Detailed socio-economic characteristics of the population are primarily published in the ACS. The 1-Year estimates are published for all geographies that have at least 65k people. Since most states have rural counties that have less than this threshold, we’ll have to use the 5-year estimates to get all the counties. The detailed tables are narrow, focusing on estimates for a single variable. The other options include profiles (lots of different data for one place) and subject tables (narrower in scope than profiles, but broader than the detailed tables).
Years. At the moment 2017 is the latest year for the ACS, so let’s select that. This quickly eliminates a lot of tables that we’re not interested in.
Geography. Choose 050 – County, then scroll down and choose Pennsylvania in the County (State) list, then All counties in Pennsylvania in the final list.

Topics. For this example choose Housing, then Financial Characteristics, then Housing Value and Purchase Price. Of all the filter options, this one is the most opened-ended and may require some experimentation based on what you’re looking for.

Codes. We don’t need to filter by codes in this example, but if we were searching for labor or business-related data we’d use this filter to limit results to specific sectors or industries by NAICS codes.
Underneath the filter menu, click the View All Results button. This brings us to the first results page, which provides a list of tables, maps, and pages related to our search. Click the button to View All Tables under the tables section.
This brings us to the table results page; the list of tables is displayed on the left, and the currently selected table is displayed on the right; in this case Value of owner-occupied housing units is shown, with counts of units by value brackets. At this stage, we can scroll through the list and browse to find tables with data that we’re interested in. We can also access the filters at the top of the list, if we want to modify our search parameters.

A little further down the results list is a table for Median Value. Selecting that table will preview it on the right. Hit the Customize Table button. This opens the table in its own dedicated view. Hit the blue drop down arrow to the right of the table name, and you can modify the geography, year, or time-period on the left. On the right is a Download option. Hit download and you’ll be prompted to download a CSV file. In the download you’ll get three text files that contain metadata, the data, and descriptive information about the download. Click Download and you can save it.

Back on the customize table page, you can navigate back to the table results by clicking on “Tables” in the breadcrumb links that appear in the top left-hand corner. Then you can browse and choose additional tables.
That’s it! Not bad, right? Well, there are always caveats. At the moment, the biggest one is that you can’t easily download most geographies that are contained within other geographies. With one click we can filter to select all counties within a state, or all states within the nation. But if we wanted all census tracts in a county or all county subdivisions in a state, there aren’t any “All geographies in…” options for these geographies. We’d have to select each and every tract within a county, one at a time…
While data.census.gov is now relatively stable, it’s still under development and additional features like this should (hopefully) be implemented as time passes between now and the 2020 census. This is one reason why the American Factfinder will survive for another year, as we’ll still need to lean on it to accomplish certain tasks. Of course, there are other options within the Census Bureau (the API, the FTP site) and without (NHGIS, MCDC, Census Reporter) for accessing data.
The new platform currently provides access to several datasets from the present back to the year 2010: the decennial census, the ACS, population estimates, and several of the business datasets. The first new datasets that will be published in data.census.gov (and NOT in the AFF) include the 2017 Economic Census this summer and the 1-year 2018 ACS in September.
View the Release Notes and FAQs for more details about the platform: general documentation, recent developments, bugs, and planned enhancements. The Census Bureau also has an archived webinar with slides that discuss the transition.
