
The Baruch GIS lab crew just published a paper: New Yorkers on the Move: Recent Migration Trends for the City and Metro Area. The paper (no. 15 Feb 2018) is part of the Weissman Center for International Business Occasional Paper Series, which focuses on New York City’s role in the international and domestic economy.
Findings
We analyzed recent population trends (2010 to 2016) in New York City and the greater metropolitan area using the US Census Bureau’s Population Estimates to study components of population change (births, deaths, domestic and international migration) and the IRS Statistics of Income division’s county to county migration data to study domestic migration flows.
Here are the main findings:
- The population of New York City and the New York Metropolitan Area increased significantly between 2010 and 2016, but annually growth has slowed due to greater domestic out-migration.
- Compared to other large US cities and metro areas, New York’s population growth depends heavily on foreign immigration and natural increase (the difference between births and deaths) to offset losses from domestic out-migration.
- Between 2011 and 2015 the city had few relationships where it was a net receiver of migrants (receiving more migrants than it sends) from other large counties. The New York metro area had no net-receiver relationships with any major metropolitan area.
- The city was a net sender (sending more migrants than it received) to all of its surrounding suburban counties and to a number of large urban counties across the US. The metro area was a net sender to metropolitan areas throughout the country.
For the domestic migration portion of the analysis we were interested in seeing the net flows between places. For example, the NYC metro area sends migrants to and receives migrants from the Miami metro. What is the net balance between the two – who receives more versus who sends more?
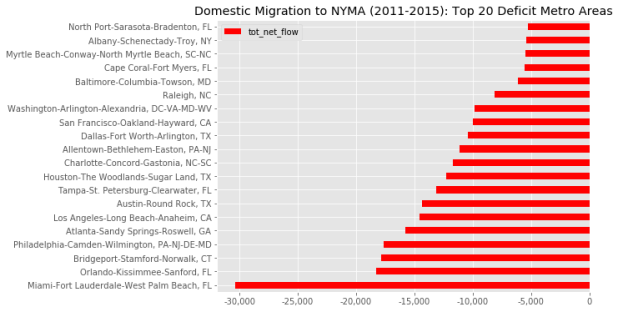
The answer is: the NYC metro is a net sender to most of the major metropolitan areas in the country, and has no significant net receiver relationships with any other major metropolitan area. For example, for the period from 2011 to 2015 the NYC metro’s largest net sender relationship was with the Miami metro. About 88,000 people left the NYC metro for metro Miami while 58,000 people moved in the opposite direction, resulting in a net gain of 30,000 people for Miami (or in other words, a net loss of 30k people for NYC). The chart below shows the top twenty metros where the NYC metro had a deficit in migration (sending more migrants to these areas than it received). A map of net out-migration from the NYC metro to other metros appears at the top of this post. In contrast, NYC’s largest net receiver relationship (where the NYC metro received more migrants than it sent) was with Ithaca, New York, which lost a mere 300 people to the NYC metro.
All of our summary data is available here.
Process
For the IRS data we used the county to county migration SQLite database that Janine meticulously constructed over the course of the last year, which is freely available on the Baruch Geoportal. Anastasia employed her Python and Pandas wizardry to create Jupyter notebooks that we used for doing our analysis and generating our charts, all of which are available on github. I used an alternate approach with Python and the SQLite and prettytable modules to generate estimates independently of Anastasia, so we could compare the two and verify our numbers (we were aggregating migration flows across years and geographies from several tables, and calculating net flows between places).
One of our goals for this project was to use modern tools and avoid the clunky use of email. With the Jupyter notebooks, git and github for storing and syncing our work, and ShareLaTeX for writing the paper, we avoided using email for constantly exchanging revised versions of scripts and papers. Ultimately I had to use latex2rtf to convert the paper to a word processing format that the publisher could use. This post helped me figure out which bibliography packages to choose (in order for latex2rtf to interpret citations and references, you need to use the older natbib & bibtex combo and not biblatex & biber).
If you are doing similar research, Zillow has an excellent post that dicusses the merits of the different datasets. There are also good case studies on Washington DC and Philadelphia that employ the same datasets.
