HIFLD Open, a key repository for accessing US GIS datasets on infrastructure, is shutting down on August 26, 2025. This is a revision from a previous announcement, which said that it would be live until at least Sept 30. The portal provided national layers for schools, power lines, flood plains, and more from one convenient location. DHS provides no sensible explanation for dismantling it, other than saying that hosting the site is no longer a priority for their mission (here’s a copy of an official announcement). In other words, “Public domain data for community preparedness, resiliency, research, and more” is no longer a DHS priority.
The 300 plus datasets in Open HIFLD are largely created and hosted by other agencies, and Open HIFLD was aggregating different feeds into one portal. So, much of the data will still be accessible from the original sources. It will just be harder to find.
DHS has published a crosswalk with links to alternative portals and the source feeds for each dataset, so you can access most of the data once Open HIFLD goes offline. I’ve saved a copy here, in case it also disappears. Most of these sources use ESRI REST APIs. Using ArcGIS Online or Pro, and even QGIS (for example), you can connect to these feeds, get a listing in your contents pane, and drag and drop layers into a project (many of the layers are also available via ArcGIS Online or the Living Atlas if you’re using Arc). Once you’ve added a layer to a project, you can export and save local copies.
Adding ArcGIS Rest Server for US Army Corps of Engineers Data in QGIS
If you want to download copies directly from Open HIFLD before it vanishes on Aug 26, I’ve created this spreadsheet with direct links to download pages, and to metadata records when available (some datasets don’t have metadata, and the links will bring you to an empty placeholder). Some datasets have multiple layers, and you’ll need to click on each one in a list to get to it’s download page. In some cases there won’t be a direct download link, and you’ll need to go to the source (a useful exercise, as you’ll need to remember where it is in the future). Alternatively, you can connect to the REST server (before Aug 26, 2025) in QGIS or ArcGIS, drag and drop the layers you want, and then export:
I’m coordinating with the Data Rescue Project, and we’re working on downloading copies of everything on Open HIFLD and hosting it elsewhere. I’ll provide an update once this work is complete. Even though most of these datasets will still be available from the original sources, better safe than sorry. There’s no telling what could disappear tomorrow.
The secure HIFLD site for registered users will remain available, but many of the open layers aren’t being migrated there (see the crosswalk for details). The secure site is available to DHS partners, and there are restrictions on who can get an account. It’s not exactly clear what they are, but it seems unlikely that most Open users will be eligible: “These instructions [for accessing a secure account] are for non-DHS users who support a homeland security or homeland defense mission AND whose role requires access to the Geospatial Information Infrastructure (GII) and/or any geospatial dashboards, data, or tools housed on the GII…“
In my previous post, I summarized several efforts to rescue and preserve US federal government datasets that are being removed from the internet. In this post, I’ll provide a basic primer on screen scraping with Python, which is what I’ve used to capture datasets in participating in the Data Rescue Project. Screen scraping can employed to many ends, such as capturing text on web pages so it can be analyzed, or taking statistics embedded in HTML tables and saving them in machine readable formats. In the context of this post, screen scraping is an approach for downloading data and documentation files stored on websites.
There are several benefits to using a scripting approach for this work. It saves you from the tedious task of clicking and downloading files one by one. The script serves as documentation for what you did, and allows you to easily repeat the process in the future, if the datasets continue to exist and are updated. A scripted, screen-scraping approach may not be best or necessary if the website and datasets are relatively small and simple, or conversely if the site is complicated and difficult to scrape given the technology it employs. In both cases, manual downloading may be quicker, especially with a team of volunteers. Furthermore, if it seems clear that the dataset or website are not going to be updated, or are going to vanish, then the benefit of repeating the process in the future is moot.
In this example, we’ll assume that screen scraping is the way to go, and we’ll use Python to do it. I’ll address a few alternatives to this approach at the end, the primary one being using an API if and when it’s available, and will share links to working code that colleagues and I have written to save datasets.
You should only apply these approaches to public, open data. Capturing restricted or proprietary information violates licenses, terms of service, and in some cases privacy constraints, and is not condoned by any of the rescue projects. Even if the data is public, bear in mind that scraping can put undue pressure on web servers. For large websites, plan accordingly by building pauses into the process, breaking up the work into segments, or running programs at non-peak times (overnight). When writing and testing scripts, don’t repeat the process over and over again on the entire website; run your tests on samples until you get everything working.
Screen Scraping Basics
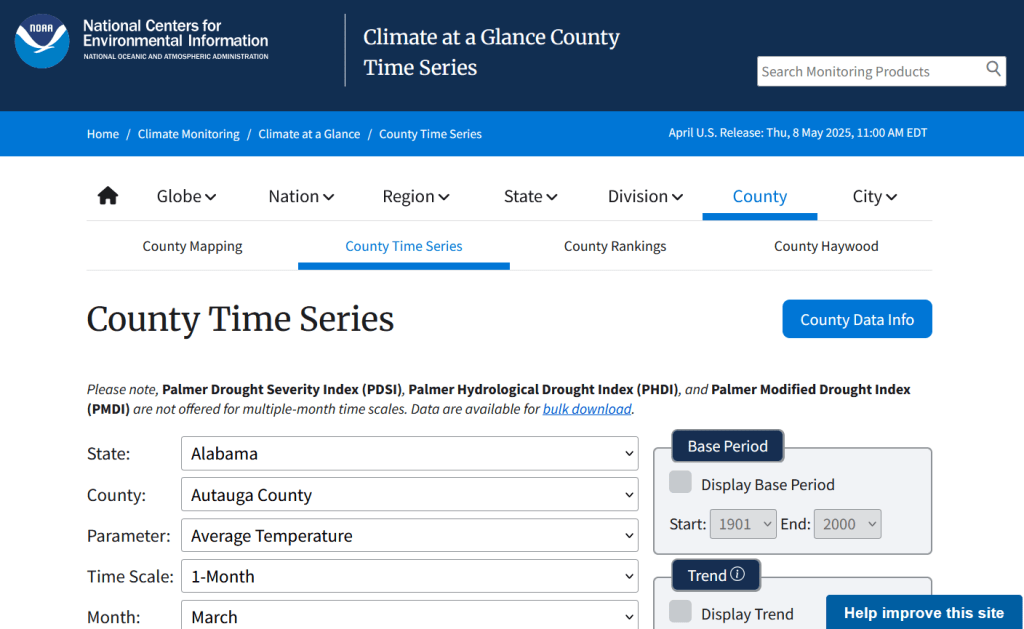
The first step is to explore the website where the data is hosted, to identify the best pages to use as a source and determine the feasibility of the approach. Many websites will have feature rich, user friendly pages that make it easy to view extracts of data and visualize it, such as the NOAA climate website below.
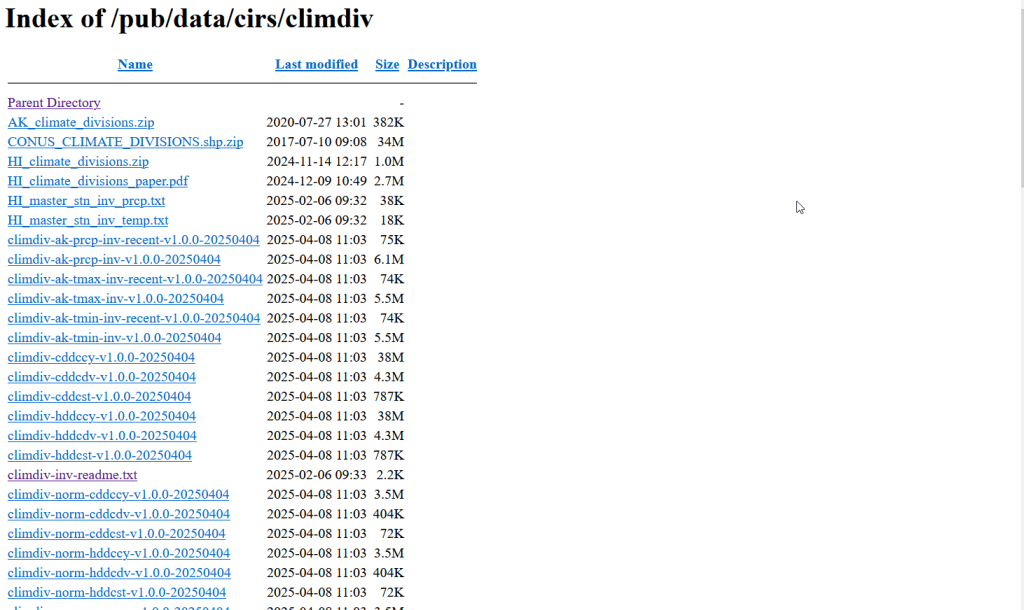
While easy to use, these pages can be complex and tedious to scrape. Always look for an option for bulk downloading datasets. They may lead you to a page sitting behind the scenes of the fancy website, such as the NOAA file directory below. Saving data from a page like this is fairly straightforward.
For the benefit of those of you who are not 1990s era people like myself and may not be familiar with working with HTML, the example below illustrates a simple webpage. With any browser, you can right click on a page and View the Source, to see the HTML code and stylesheets behind the page, which the browser processes and renders to display the site. HTML is a markup language where text is enclosed in tags that tell us something about the content within the tags, and which can be used for displaying the content in different ways. HTML is also hierarchical, so that content can be nested. For example, there is a head section that contains preliminary content about the page, and a body section that encloses the main content. Within the body there can be divisions, and anchor tags that represent links. In this example, one of these anchors is a link to a data file that we want to download.
We can use Python to parse these tags and pull out desired content. There are four core modules I always use: Requests for downloading content, os for creating folders and working with paths, Beautiful Soup for screen scraping, and datetime for creating time stamps. In the code below, we begin by importing the modules and saving the url of the page we wish to scrape as a variable.
In most Python environments (unless you’ve modified some settings) it’s assumed that your current working directory is the folder where your Python script is stored. When you download files, they will automatically be stored in that folder. To keep things tidy, I always create a subfolder named with the date; I use the date function from datetime to retrieve today’s date, append that date to the word “downloaded-‘, and use the os module to create a subfolder with that name. If we run the program at a later date it will save everything in a new folder, rather than overwriting existing files.
import requests, os
from bs4 import BeautifulSoup as soup
from datetime import date

url='https://www.page.gov'

today = str(date.today())
outfolder='downloaded-'+today
if not os.path.exists(outfolder):
    os.makedirs(outfolder)

webpage=requests.get(url).content
soup_page=soup(webpage,'html.parser')
page_title = soup_page.title.text
container=soup_page.find('div',{'class':'content'})
links=container.findAll('a')
The final block in this example captures data from the website. We use requests to get the content stored at the url (the webpage), and then we pass this to Beautiful Soup, which parses all the HTML using their tags. Once parsed, we can retrieve specific objects. For example, we can save the page title (the text that appears in the heading of your browser for a particular site) as a variable. We also grab the section of the page that contains the links we want to capture by looking for a specific div or id tag. This isn’t strictly necessary for simple pages like this one, but speeds up processing for larger, more complex pages. Lastly, we can search through that specific container to find all the anchor tags, or links.
Once we have the links, we loop through and save the ones we want. My preference is to store them in a dictionary as key / value pairs, where the key is the name of the file, and the value is the file’s URL. We iterate through the links we saved, and with the soup we determine if the link has an ‘href’ attribute. If it does, we see if it ends with .zip, which is the data file. This skips any link that’s not a file we want, including links that go to other webpages as opposed to files. In practice, I provide a list of several file types here such as .zip, .csv, .txt, .xlsx, .pdf, etc to capture anything that could be data or documentation. If we find the zip, we split the link’s attributes from one string of text into a list of strings that are separated by the backslash, and grab the last element, which is the name of the file. Lastly, we add this to our datalinks dictionary; in this example, we’d have: {'data.zip':'https://www.page.gov/data.zip'}.
datalinks={}

for lnk in links:
    if 'href' in lnk.attrs:
        if lnk.attrs['href'].endswith(('.zip')):
            fname=lnk.attrs['href'].split('/')[-1]
            datalinks[fname]=lnk.attrs['href']
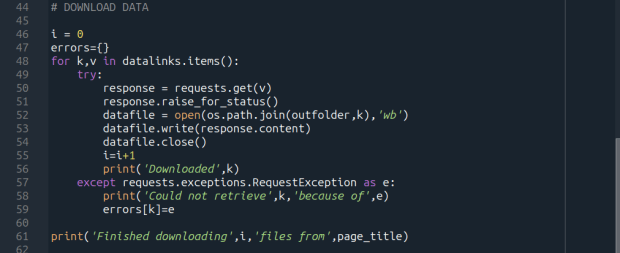
Time to download! We loop through each key (file name) and value (url) in our dictionary. We use the requests module to try and get the url (v), but if there’s a problem with the website or the link is invalid we bail out. If successful, we use the os module to go to our output folder and we supply the name of the file from the website (k) as the name of the file that we want to store on our computer. The ‘wb’ parameter specifies that we’re writing bytes to a file. I always like to keep count of the number of files I’ve done with an iterator (i) so I can print messages to a screen or a log file.
i = 0
for k,v in datalinks.items():
    try:
        response=requests.get(v)
        response.raise_for_status()
        dfile=open(os.path.join(outfolder,k),'wb')
        dfile.write(response.content)
        dfile.close()
        i=i+1
        print('Downloaded',k)
    except requests.exceptions.RequestException as e:
        print('Could not get',k,'because of',e)
print('Downloaded',i,'files from',page_title)
It’s important to save documentation too, so people can understand how the data was created and structured. In addition to saving pdf and text files, you can also save a vanilla copy of the website; I use a generic name with a date stamp. This saves the basic HTML text of the page, but not any images, documents, or styling. Which is usually good enough for providing documentation.
As mentioned previously, you don’t want to place undue burden on the webserver. With the time module, you can use the sleep function and add a pause to your script for a fixed amount of time, usually at the end of a loop, or after your iterator has recorded a certain number of files. The random module allows you to supply a random time value within a range, if you want to vary the length of the pause.
import time
from random import randint

# Pause fixed amount
time.sleep(5)

# Pause random amount within a range
time.sleep(randint(10,20))
Screen Scraping Caveats
Those are the basics! Now here are the primary exceptions. The first problem is that links to files may not be absolute links that contain the entire path to a file. Sometimes they’re relative, containing a reference to just the subfolder and file. The requests module won’t be able to find these, so we have to take the extra step of building the full path, as in the example below. You can do this by identifying what the relative path starts with (unless they’re all relative and the same), and you create the absolute by adding (concatenating) the root url and the relative one contained in the soup.
    <div class='content'>
        <p>Paragraph with text.</p>
        <a href='/us/data.zip'/>
    </div>
url='https://www.page.gov'
datalinks={}
for lnk in links:
    if lnk.attrs['href'].endswith(('.zip')):
        if lnk.attrs['href'].startswith('/us/'):
            fname=lnk.attrs['href'].split('/')[-1]
            datalinks[fname]=url+lnk.attrs['href']
            ...
In other cases, a link to a data file may not lead directly to the file, but leads to another web page where that file is stored. We can embed another scraping block into a loop; retrieve and start scraping the main page, then once you find a link go to that page, and repeat retrieval and scraping. In these cases, it’s best to save these steps in a function, so you can call the function multiple times instead of repeating the same code.
<div class='content'>
        <p>Paragraph with text.</p>
        <a href='https://www.page.gov/us/'>
 </div>
Some websites will have dedicated pages where they embed a parameter in the url, such as codes for countries or states. If you know what these are, you can define them in a list, and iterate through that list by formatting the url to insert the code, and then scrape that page. If a page uses a unique integer as an ID and you know what the upper limit is, you can use for i in range(1,n) to step through each page (but make sure you handle exceptions, in case an integer isn’t used or is missing).
codes=['us','ca','mx']
url='https://www.page.gov/{}'
for c in codes:
    webpage=requests.get(url.format(c)).content
    soup_page=soup(webpage,'html.parser')
    ...
For complicated sites with several pages, you might not want to dump all the files into the same folder. Instead, as you iterate through pages, you can create a dedicated folder for that iteration. Using the example above, if there is a page for each country code, you can create a folder for that code and when writing files, use the path module to store files in that folder for that iteration.
codes=['us','ca','mx']
for c in codes:
    ...
    cfolder=os.path.join(outfolder,c)
        if not os.path.exists(cfolder):
            os.makedirs(cfolder)
    ...
    response=requests.get(v)
        response.raise_for_status()
        dfile=open(os.path.join(cfolder,k),'wb')
        dfile.write(response.content)
        dfile.close()
For websites with lots of files, or with a few big files, you may run out of memory during the download process and your script will go kaput. To avoid this, you can stream a file in chunks instead of trying to download it in one go. Use the request module’s iter_content function, and supply a reasonable chunk size in bytes (10000000 bytes is 10 MB).
...
try:
    with requests.get(v,stream=True) as response:
        response.raise_for_status()
        fpath=os.path.join(outfolder,k)
        with open(fpath,'wb') as writefile:
            for chunk in response.iter_content(chunk_size=10000000):
                writefile.write(chunk)
    i=i+1
    print('Downloaded',k)
except requests.exceptions.RequestException as e:
        print('Could not get',fname,'because of',e)
If you view the page source for a website, and don’t actually see the anchor links and file names in the HTML, you’re probably dealing with a page that employs JavaScript, which is a show stopper if you’re using Beautiful Soup. There may be a dropdown menu or option you have to choose first, in order to render the actual page (and you may be able to use the page parameters trick above, if the url on each page varies). But you may be stuck; instead of links, there may be download buttons you have to press or a dropdown menu option you have to choose in order to download the file.
One option would be to use a Python module called Selenium, which allows you to automate the process of using a web browser, to open a page, find a button, and click it. I’ve tried Selenium with some success, but find that it’s complex and clunky for screen scraping. It’s browser dependent (you’re automating the use of a browser, and they’re all different), and you’re forced to incorporate lots of pauses; waiting for a page to load before attempting to parse it, and dealing with pop up menus in the browser as you attempt to download multiple files, etc.
Another option that I’m not familiar with, and thus haven’t tried, would be to use JavaScript since that’s what the page uses. Most browsers have web developer console add-ons that allow you to execute snippets of JavaScript code in order to do something on a page. So some automation may be possible.
Using an API
You may be able to avoid scraping altogether if the data is made available via an API. With a REST API, you pass parameters into a base link to make a specific request. Using requests, you go to that URL, and instead of getting a web page you get the data that you’ve asked for, usually packaged in a JSON type object within your program (Python or another scripting language). Some APIs retrieve documents or dataset files, that you can stream and download as described previously. But most APIs for statistical data retrieve individual data records, which you would store in a nested list or dictionary and then write out to a CSV. The example below grabs the total population for four large cities in Rhode Island from 2020 decennial census public redistricting dataset.
import requests,csv

year='2020'
dsource='dec' # survey
dseries='pl' # dataset
cols='NAME,P1_001N' # variables
state='44' # geocodes for states
place='19180,54640,59000,74300' # geocodes for places
outfile='census_pop2020.csv'
keyfile='census_key.txt'

with open(keyfile) as key:
	api_key=key.read().strip()

base_url = f'https://api.census.gov/data/{year}/{dsource}/{dseries}'

# for sub-geography within larger geography - geographies must nest
data_url = f'{base_url}?get={cols}&for=place:{place}&in=state:{state}&key={api_key}'

response=requests.get(data_url)

popdata=response.json()
for record in popdata:
    print(record)

with open(outfile, 'w', newline='') as writefile:
    writer=csv.writer(writefile, quoting=csv.QUOTE_MINIMAL, delimiter=',')
    writer.writerows(popdata)
The benefit of an API is that it’s designed to retrieve machine readable data, and might be easier than scraping pages that have complex interfaces. The major downside is, if you’re forced to download individual records as opposed to entire files, the process can take a long time, to the point where it may be infeasible if the datasets are too large. It’s always worth checking to see if there is a bulk download option as that could be easier and more efficient (for example, the Census Bureau has an FTP site for downloading datasets in their entirety). Using an API also requires you to invest time in studying how it works, so you can build the appropriate links and ensure that you’re capturing everything.
Conclusion
Screen scraping will vary from website to website, but once you have enough examples it becomes easy to resample your code. You’ll always need to modify the Beautiful Soup step based on the structure of the individual pages, but the requests downloading step is more rote and may not require much modification. While I use Python, you can use other languages like R to achieve similar results.
Visit my library’s US Federal Government Data Backup GitHub for working examples of code that I and colleagues have used to capture datasets. In my programs I’ve added extra components, like writing a basic metadata file and error logs, which I haven’t covered in this post. The NOAA County at a Glance, IRS-SOI, and IMLS, scripts are basic examples, and the IMLS ones include some of the caveats I’ve described. The NOAA lake and sea level rise scripts are far more complex, and include cycling through many pages, creating multiple folders, streaming downloads, and encapsulating processes into functions. The USAID DHS Indicators scripts used APIs that retrieved files, while the USAID DHS SDR script used Selenium to step through a series of JavaScript pages.
You’ll find scripts but no datasets in the GitHub repo due to file size limitations. If you’re a member of an institution that has access to GLOBUS, you can access the data files by following the instructions at the top of the page. Otherwise, we’ve contributed all of our datasets to DataLumos (except for the sea level rise data, I’m working with another university to host that).
I made my first foray into network routing recently, and drafted a python script and notebook that plots routes using the OpenRouteService (ORS) API. ORS is based on underlying data from the OpenStreetMap (OSM), and was created by the Heidelberg Institute for Geoinformation Technology, at Heidelberg University in Germany. They publish several routing APIs that include directions, isochrones, distance matricies, geocoding, and route optimization. You can access them via a basic REST API, but they also have a dedicated Python wrapper and an R package which makes things a bit easier. For non-programmers, there is a plugin for QGIS.
Regardless of which tool you use, you need to register for an API key first. The standard plan is free for small projects; for example you can make 2,000 direction requests per day with a limit of 40 per minute. If you’re affiliated with higher ed, government, or a non-profit and are doing non-commercial research, you can upgrade to a collaborative plan that ups the limits. It’s also possible to install OSR locally on your own server for large jobs.
I opted for Python and used the openrouteservice Python module, in conjunction with other geospatial modules including geopandas and shapely. In my script / notebook I read in two CSV files, one with origins and the other with destinations. At minimum both files must contain a header row, and attributes for unique identifier, place label, longitude, and latitude in the WGS 84 spatial reference system. The script plots a route between each origin and every destination, and outputs three shapefiles that include the origin points, destination points, and routes. Each line in the route file includes the ID and names of each origin and destination, as well as distance and travel time. The script and notebook are identical, except that the script plots the end result (points and lines) using geopanda’s plot function, while the Jupyter Notebook plots the results on a Folium map (Folium is a Python implementation of the popular Leaflet JS langauge).
After importing the modules, you define several variables that determine the output, including a general label for naming the output file (routename), and several parameters for the API including the mode of travel (driving, walking, cycling, etc), distance units (meters, kilometers, miles), and route preference (fastest or shortest). Next, you provide the positions or “column” locations of attributes in the origin and destination CSV files for the id, name, longitude, and latitude. Lastly, you specify the location of those input files and the file that contains your API key. The location and names of output files are generated automatically based on the input; all will contain today’s date stamp, and the route file name includes route mode and preference. I always use the os module’s path function to ensure the scripts are cross-platform.
import openrouteservice, os, csv, pandas as pd, geopandas as gpd
from shapely.geometry import shape
from openrouteservice.directions import directions
from openrouteservice import convert
from datetime import date
from time import sleep

# VARIABLES
# general description, used in output file
routename='scili_to_libs'
# transit modes: [“driving-car”, “driving-hgv”, “foot-walking”, “foot-hiking”, “cycling-regular”, “cycling-road”,”cycling-mountain”, “cycling-electric”,]
tmode='driving-car'
# distance units: [“m”, “km”, “mi”]
dunits='mi'
# route preference: [“fastest, “shortest”, “recommended”]
rpref='fastest'

# Column positions in csv files that contain: unique ID, name, longitude, latitude
# Origin file
ogn_id=0
ogn_name=1
ogn_long=2
ogn_lat=3
# Destination file
d_id=0
d_name=1
d_long=2
d_lat=3

# INPUTS and OUTPUTS
today=str(date.today()).replace('-','_')

keyfile='ors_key.txt'
origin_file=os.path.join('input','origins.csv') #CSV must have header row
dest_file=os.path.join('input','destinations.csv') #CSV must have header row
route_file=routename+'_'+tmode+'_'+rpref+'_'+today+'.shp'
out_file=os.path.join('output',route_file)
out_origin=os.path.join('output',os.path.basename(origin_file).split('.')[0]+'_'+today+'.shp')
out_dest=os.path.join('output',os.path.basename(dest_file).split('.')[0]+'_'+today+'.shp')
I define some general functions for reading the origin and destination files into nested lists, and for taking those lists and generating shapefiles out of them (by converting them to geopanda’s geodataframes). We read the origin and destination data in, grab the API key, set up a list to hold the routes, and create a header for the eventual output.
# For reading origin and dest files
def file_reader(infile,outlist):
    with open(infile,'r') as f:
        reader = csv.reader(f)
        for row in reader:
            rec = [i.strip() for i in row]
            outlist.append(rec)

# For converting origins and destinations to geodataframes
def coords_to_gdf(data_list,long,lat,export):
    """Provide: list of places that includes a header row,
    positions in list that have longitude and latitude, and
    path for output file.
    """
    df = pd.DataFrame(data_list[1:], columns=data_list[0])
    longcol=data_list[0][long]
    latcol=data_list[0][lat]
    gdf = gpd.GeoDataFrame(df, geometry=gpd.points_from_xy(df[longcol], df[latcol]), crs='EPSG:4326')
    gdf.to_file(export,index=True)
    print('Wrote shapefile',export,'\n')
    return(gdf)

origins=[]
dest=[]
file_reader(origin_file,origins)
file_reader(dest_file,dest)

# Read api key in from file
with open(keyfile) as key:
    api_key=key.read().strip()

route_count=0
route_list=[]
# Column header for route output file:
header=['ogn_id','ogn_name','dest_id','dest_name','distance','travtime','route']
Here are some nested lists from my sample origin and destination CSV files:
Then the API call begins. For every record in the origin list, we iterate through each record in the destination list (in both cases starting at index 1, skipping the header row) and calculate a route. We create a tuple with each pair of origin and destination coordinates (coords), which we supply to the OSR directions API. We pass in the parameters supplied earlier, and specify instructions as False (instructions are the actual turn by turn directions returned as text).
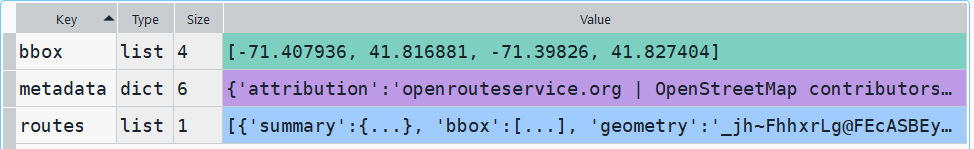
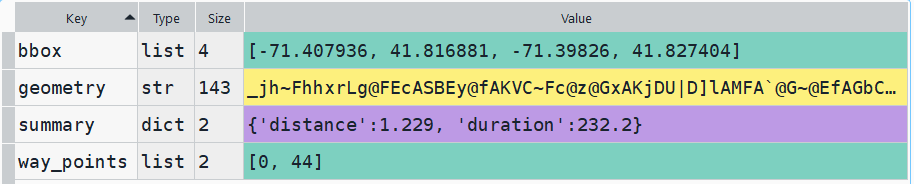
The result is returned as a JSON object, which we can manipulate like a nested Python dictionary. At the first level in the dictionary, we have three keys and values: a bounding box for the route area with a list value, metadata with a dictionary value, and routes with a list value. Dive into route, and the list contains a single dictionary, and inside that dictionary – more dictionaries that contain the values we want!
1st level, dictionary with three keys, the routes key has a single list value2nd level, the routes list has a single element, another dictionary3rd level, inside the dictionary in that list element, four keys with route data
The next step is we extract the values that we need from this container by specifying their location. For example, the distance value is inside the first list of routes, inside summary and inside distance. Travel time is in a similar spot, and we take an extra step of dividing by 60 to get minutes instead of seconds. The geometry is trickier as its encoded in some binary line format. We use OSR’s decoding function to turn it into plain text, and shapely to convert it into WKT text; we’ll need WKT in order to get the geometry into a geodataframe, and eventually output as a shapefile. Once we have the bits we need, we string them together as a list for that origin / destination pair, and append this to our route list.
# API CALL
for ogn in origins[1:]:
    for d in dest[1:]:
        try:
            coords=((ogn[ogn_long],ogn[ogn_lat]),(d[d_long],d[d_lat]))
            client = openrouteservice.Client(key=api_key)
            # Take the returned object, save into nested dicts:
            results = directions(client, coords,
                                profile=tmode,instructions=False, preference=rpref,units=dunits)
            dist = results['routes'][0]['summary']['distance']
            travtime=results['routes'][0]['summary']['duration']/60 # Get minutes
            encoded_geom = results['routes'][0]['geometry']
            decoded_geom = convert.decode_polyline(encoded_geom) #convert from binary to txt
            wkt_geom=shape(decoded_geom).wkt #convert from json polyline to wkt
            route=[ogn[ogn_id],ogn[ogn_name],d[d_id],d[d_name],dist,travtime,wkt_geom]
            route_list.append(route)
            route_count=route_count+1
            if route_count%40==0: # API limit is 40 requests per minute
                print('Pausing 1 minute, processed',route_count,'records...')
                sleep(60)
        except Exception as e:
            print(str(e))

api_key=''
print('Plotted',route_count,'routes...' )
Here is some sample output for the final origin / destination pair, which contains the IDs and labels for the origin and destination, distance in miles, time in minutes, and a string of coordinates that represents the route:
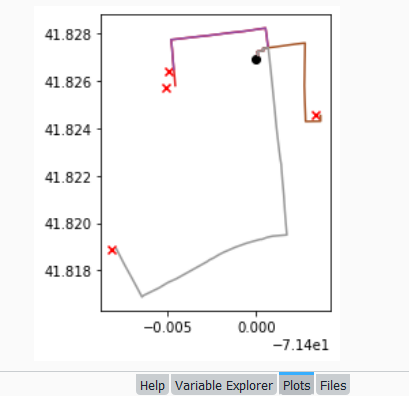
Finally, we can write the output. We convert the nested route list to a pandas dataframe and use the header row for column names, and convert that dataframe to a geodataframe, building the geometry from the WKT string, and write that out. In contrast, the origins and destinations have simple coordinates (not in WKT), and we create XY geometry from those coordinates. Writing the geodataframe out to a shapefile is straightforward, but for debugging purposes it’s helpful to see the result without having to launch GIS. We can use geopandas’s plot function to draw the resulting geometry. I’m using the Spyder IDE, which displays plots in a dedicated window (in my example the coordinate labels for the X axis look strange, as the distances I’m plotting are small).
# Create shapefiles for routes
df = pd.DataFrame(route_list, columns=header)
gdf = gpd.GeoDataFrame(df, geometry=gpd.GeoSeries.from_wkt(df["route"]),crs = 'EPSG:4326')
gdf.drop(['route'],axis=1,inplace=True) # drop the wkt text
gdf.to_file(out_file,index=True)
print('Wrote route shapefile to:',out_file,'\n')

# Create shapefiles for origins and destinations
ogdf=coords_to_gdf(origins,ogn_long,ogn_lat,out_origin)
dgdf=coords_to_gdf(dest,d_long,d_lat,out_dest)

# Plot
base=gdf.plot(column="dest_id", kind='geo',cmap="Set1")
ogdf.plot(ax=base, marker='o',color='black')
dgdf.plot(ax=base, marker='x', color='red');
In a notebook environment we can employ something like Folium more readily, which gives us a basemap and some basic interactivity for zooming around and clicking on features to see attributes. Implementing this was a more complex than I thought it would be, and took me longer to figure out compared to the routing process. I’ll return to those details in a subsequent post…
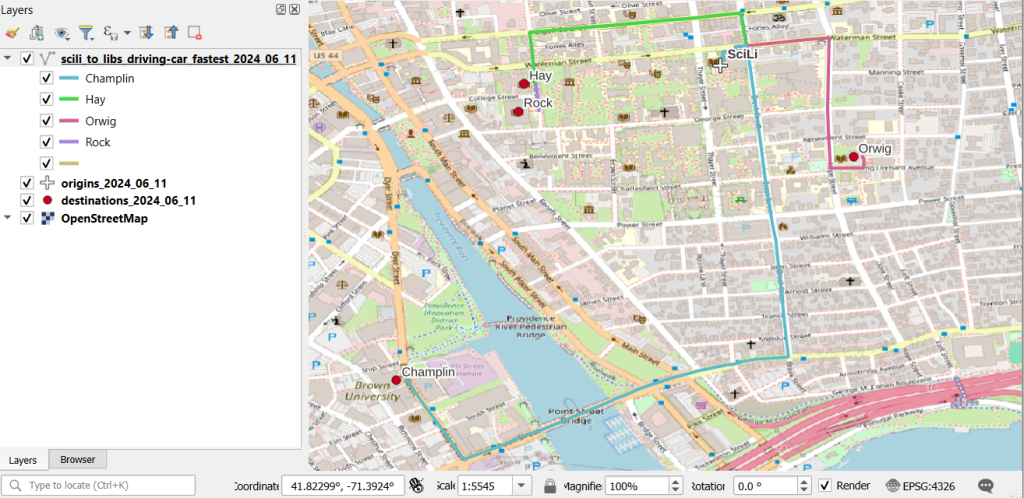
In my sample data (output rendered below in QGIS) I was plotting fastest driving distance from the Brown University Sciences Library to the other libraries in our system. Compared to Google or Apple Maps the result made sense, although the origin coordinates I used for the SciLi had an impact on the outcome (assumed you left from the loading dock behind the building as opposed to the front door as Google did, which produces different routes in this area of one-way streets). My real application was plotting distances of hundreds of miles across South America, which went well and was useful for generating different outcomes using fastest or shortest route.
Even though I’ve left New York, there are still occasions where I refer back to NYC resources in order to help students and faculty here with NYC-based research. Most recently I’ve revisited NYC DOITT’s Geoclient API for geocoding addresses, and I discovered a number of things have changed since I’ve last used it a few years ago. I’ll walk through my latest geocoding script in this post.
First and foremost: if you landed on this page because you’re trying to figure out how to get your Geoclient API key to work, the answer is:
&subscription-key=YOURKEYHERE
This replaces the old format that required you to pass an app id and key. I searched through two websites and scanned through hundreds of pages of documentation, only to find this solution in a cached Google search result, as the new docs don’t mention this change and the old docs still have the previous information and examples of the application ID and key. So – hopefully this should save you some hours of frustration.
I was working with someone who needed to geocode a subset of the city’s traffic violation data from the open data portal, as the data lacks coordinates. It’s also missing postal city names and ZIP Codes, which precludes using most geocoders that rely on this information. Even if we had these fields, I’ve found that many geocoders struggle with the hyphenated addresses used throughout Queens, and some work-around is needed to get matches. NYC’s geoclient is naturally able to handle those Queens addresses, and can use the borough name or code for locating addresses in lieu of ZIP Codes. The traffic data uses pseudo-county codes, but it’s easy to replace those with the corresponding borough codes.
The older documentation is still solid for illustrating the different APIs and the variables that are returned; you can search for a parsed or non-parsed street address, street intersections, places of interest or landmarks, parcel blocks and lots, and a few others.
I wrote some Python code that I’ve pasted below for geocoding addresses that have house numbers, street, and borough stored in separate fields using the address API, and if the house number is missing we try again by doing an intersection search, as an intersecting street is stored in a separate field in the traffic data. In the past I used a thin client for accessing the API, but I’m skipping that as it’s simpler to just build the URLs directly with the requests module.
The top of the script has the standard stuff: the name of the input file, the column locations (counting from zero) in the input file that contain each of the four address components, the base URL for the API, a time function for progress updates, reading the API key in from a file, and looping through the input CSV with the addressees to save the header row in one list and the records in a nested list. I created a list of fields that are returned from the API that I want to hold on to and add them to the header row, along with a final variable that records the results of the match. In addition to longitude and latitude you can also get xCoordinate and yCoordinate, which are in the NY State Plane Long Island (ft-US) map projection. I added a counts dictionary to keep track of the result of each match attempt.
Then we begin a long loop – this is a bit messy and if I had more time I’d collapse much of this into a series of functions, as there is repetitive code. I loop through the index and value of each record beginning with the first one. The loop is in a try / except block, so in the event that something goes awry it should exit cleanly and write out the data that was captured. We take the base url and append the address request, slicing the record to get the values for house, street, and borough into the URL. An example of a URL after passing address components in:
https://api.nyc.gov/geo/geoclient/v1/address.json?houseNumber=12345&street=CONEY ISLAND AVE&borough=BROOKLYN&subscription-key=KEYGOESHERE
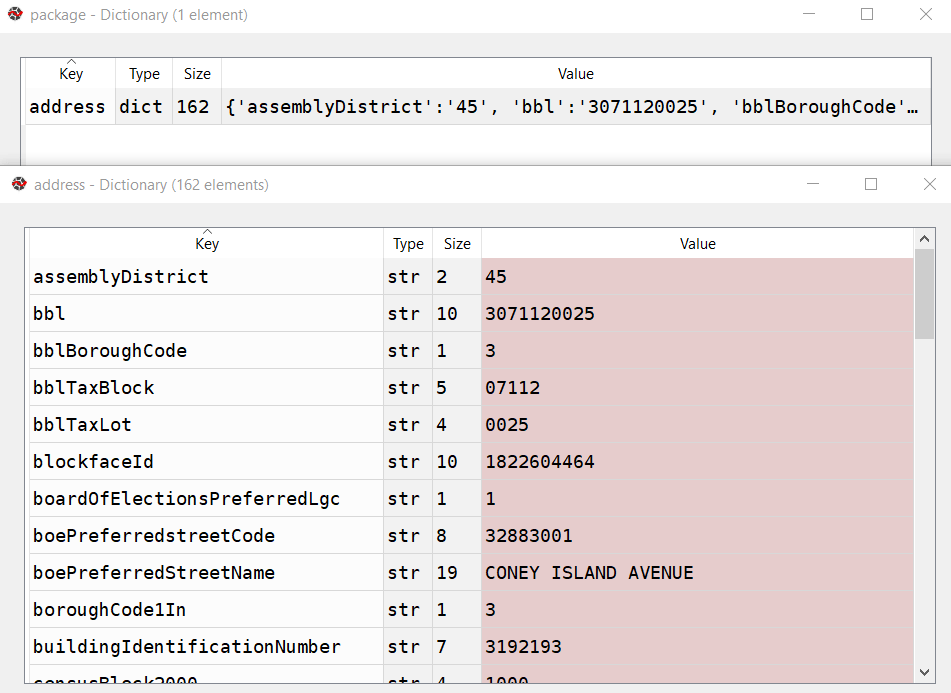
Pass that URL to the requests module and get a response back. If an address is returned, the JSON resembles a Python dictionary, with ‘address’ as the key and the value as another dictionary with key value pairs of several variables. Otherwise, we get an error message that something was wrong with the request.
A successful address match returns an address dictionary, with a sub-dictionary of keys and values
The loop logic:
If the package contains an ‘address’ key, flatten to get the sub-dictionary
If ‘longitude’ is present as a key, a match is returned, get the relevant fields and append to the record
Else if the dictionary contains a ‘message’ key with a value that the house number was missing, do an intersection match
If the package contains an ‘intersection’ key, flatten to get the sub-dictionary
If ‘longitude’ is present as a key, a match is returned, get the relevant fields and append to the record
If not, there was no intersection match, just get the messages and append blanks for each value to the record
If not, an error was returned, capture the error and append blanks for each value to the record, and continue
If not, there was no address match, just get the messages and append blanks for each value to the record
If not, an error was returned, capture the error and append blanks for each value to the record, and continue
The API has limits of 2500 matches per minute and 500k per day, so after 2000 records I built in a pause of 15 seconds. Once the process finishes, successfully or not, the records are written out to a CSV file, header row first followed by the records. If the process bailed prematurely, the last record and its index are printed to the screen. This allows you to rerun the script where you left off, by changing the start index in the variables list at the top of the script from 0 to the last record that was read. When it comes time to write output, the previous file is appended rather than overwritten and the header row isn’t written again.
It took about 90 minutes to match a file of 25,000 records. I’d occasionally get an error message that the API key was bad for a given record; the error would be recorded and the script continued. It’s likely that there are illegal characters in the input fields for the address that end up creating a URL where the key parameter can’t be properly interpreted. I thought the results were pretty good; beyond streets it was able to recognize landmarks like large parks and return matched coordinates with relevant error messages (example below). Most of the flops were, not surprisingly, due to missing borough codes or house numbers.
Output fields from the NYC Geoclient written to CSV
To use this code you’ll need to sign up for an NYC Developer API account, and then you can request a key for the NYC Geoclient service. Store the key in a text file in the same folder as the script. I’m also storing inputs and outputs in the same folder, but with a few functions from the os module you can manipulate paths and change directories. If I get time over the winter break I may try rewriting to incorporate this, plus functions to simplify the loops. An alternative to the API would be to download the LION street network geodatabase, and you could set up a local address locator in ArcGIS Pro. Might be worth doing if you had tons of matches to do. I quickly got frustrated with with the ArcGIS documentation and after a number of failed attempts I opted to use the Geoclient instead.
"""
Match addresses to NYC Geoclient using house number, street name, and borough
Frank Donnelly / GIS and Data Librarian / Brown University
11/22/2021 - Python 3.7
"""

import requests, csv, time

#Variables
addfile='parking_nov2021_nyc.csv' #Input file with addresses
matchedfile=addfile[:-4]+'_output.csv' #Output file with matched data
keyfile='nycgeo_key.txt' #File with API key
start_idx=0 #If program breaks, change this to pick up with record where you left off
#Counting from 0, positions in the CSV that contain the address info
hous_idx=23
st_idx=24
boro_idx=21
inter_idx=25
base_url='https://api.nyc.gov/geo/geoclient/v1/'

def get_time():
    time_now = time.localtime() # get struct_time
    pretty_time = time.strftime("%m/%d/%Y, %H:%M:%S", time_now)
    return pretty_time

print('*** Process launched at', get_time())

#Read api key in from file
with open(keyfile) as key:
    api_key=key.read().strip()

records=[]

with open(addfile,'r') as infile:
    reader = csv.reader(infile)
    header = next(reader) # Capture column names as separate list
    for row in reader:
        records.append(row)

# Fields returned by the API to capture
# https://maps.nyc.gov/geoclient/v1/doc
fields=['message','message2','houseNumber','firstStreetNameNormalized',
        'uspsPreferredCityName','zipCode','longitude','latitude','xCoordinate',
        'yCoordinate']
header.extend(fields)
header.append('match_result')
datavals=len(fields)-2 # Number of fields that are not messages
counts={'address match':0, 'intersection match':0,
        'failed address':0, 'failed intersection':0,
        'error':0}

print('Finished reading data from', addfile)
print('*** Geocoding process launched at',get_time())

for i,v in enumerate(records[start_idx:]):
    try:
        data_url = f'{base_url}address.json?houseNumber={v[hous_idx]}&street={v[st_idx]}&borough={v[boro_idx]}&subscription-key={api_key}'
        response=requests.get(data_url)
        package=response.json()
        # If an address is returned, continue
        if 'address' in package:
            result=package['address']
            # If longitude is returned, grab data
            if 'longitude' in result:
                for f in fields:
                    item=result.get(f,'')
                    v.append(item)
                v.append('address match')
                counts['address match']=counts['address match']+1
            # If there was no house number, try street intersection match instead
            elif 'message' in result and result['message']=='INPUT CONTAINS NO ADDRESS NUMBER' and v[inter_idx] not in ('',None):
                try:
                    data_url = f'{base_url}intersection.json?crossStreetOne={v[st_idx]}&crossStreetTwo={v[inter_idx]}&borough={v[boro_idx]}&subscription-key={api_key}'
                    response=requests.get(data_url)
                    package=response.json()
                    # If an intersection is returned, continue
                    if 'intersection' in package:
                        result=package['intersection']
                        # If longitude is returned, grab data
                        if 'longitude' in result:
                            for f in fields:
                                item=result.get(f,'')
                                v.append(item)
                            v.append('intersection match')
                            counts['intersection match']=counts['intersection match']+1
                        # Intersection match fails, append messages and blank values
                        else:
                            v.append(result.get('message',''))
                            v.append(result.get('message2',''))
                            v.extend(['']*datavals)
                            v.append('failed intersection')
                            counts['failed intersection']=counts['failed intersection']+1
                    # Error returned instead of intersection
                    else:
                        v.append(package.get('message',''))
                        v.append(package.get('message2',''))
                        v.extend(['']*datavals)
                        v.append('error')
                        counts['error']=counts['error']+1
                        print(package.get('message',''))
                        print('Geocoder error at record',i,'continuing the matching process...')
                except Exception as e:
                     print(str(e))
            # Address match fails, append messages and blank values
            else:
                v.append(result.get('message',''))
                v.append(result.get('message2',''))
                v.extend(['']*datavals)
                v.append('failed address')
                counts['failed address']=counts['failed address']+1
        # Error is returned instead of address
        else:
            v.append(package.get('message',''))
            v.append(package.get('message2',''))
            v.extend(['']*datavals)
            v.append('error')
            counts['error']=counts['error']+1
            print(package.get('message',''))
            print('Geocoder error at record',i,'continuing the matching process...')
        if i%2000==0:
            print('Processed',i,'records so far...')
            time.sleep(15)
    except Exception as e:
        print(str(e))

# First attempt, write to new file, but if break happened, append to existing file
if start_idx==0:
    wtype='w'
else:
    wtype='a'

end_idx=start_idx+i

with open(matchedfile,wtype,newline='') as outfile:
    writer = csv.writer(outfile, delimiter=',', quotechar='"',
                        quoting=csv.QUOTE_MINIMAL)
    if wtype=='w':
        writer.writerow(header)
        writer.writerows(records[start_idx:end_idx])
    else:
        writer.writerows(records[start_idx:end_idx])
print('Wrote',i+1,'records to file',matchedfile)
print('Final record written was number',i,':\n',v)
for k,val in counts.items():
    print(k,val)
print('*** Process finished at',get_time())
I’m working on a project where I needed to generate a list of all the administrative subdivisions (i.e. states / provinces, counties / departments, etc) and their ID codes for several different countries. In this post I’ll demonstrate how I accomplished this using the Geonames API and Python. Geonames (https://www.geonames.org/) is a gazetteer, which is a directory of geographic features that includes coordinates, variant place names, and identifiers that classify features by type and location. Geonames includes many different types of administrative, populated, physical, and built-environment features. Last year I wrote a post about gazetteers where I compared Geonames with the NGA Geonet Names Server, and illustrated how to download CSV files for all places within a given country and load them into a database.
In this post I’ll focus on using an API to retrieve gazetteer data. Geonames provides over 40 different REST API services for accessing their data, all of them well documented with examples. You can search for places by name, return all the places that are within a distance of a set of coordinates, retrieve all places that are subdivisions of another place, geocode addresses, obtain lists of centroids and bounding boxes, and much more. Their data is crowd sourced, but is largely drawn from a body of official gazetteers and directories published by various countries.
This makes it an ideal source for generating lists of administrative divisions and subdivisions with codes for multiple countries. This information is difficult to find, because there isn’t an international body that collates and freely provides it. ISO 3166-1 includes the standard country codes that most of the world uses. ISO 3166-2 includes codes for 1st-level administrative divisions, but ISO doesn’t freely publish them. You can find them from various sources; Wikipedia lists them and there are several gist and github repos with screen scraped copies. The US GNA is a more official source that includes both ISO 3166 1 and 2. But as far as I know there isn’t a solid source for codes below the 1st level divisions. Many countries create their own systems and freely publish their codes (i.e. ANSI FIPS codes in the US, INSEE COG codes in France), but that would require you to tie them altogether. GADM is the go to source for vector-based GIS files of country subdivisions (map at the top of this post for example). For some countries they include ISO division codes, but for others they don’t (they do employ the HASC codes from Statoids, but it’s not clear if these codes are still being actively maintained) .
Geonames to the rescue – you can browse the countries on the website to see the country and 1st level admin codes (see image below), but the API will give us a quick way to obtain all division levels. First, you have to register to get an API username – it’s free – and you’ll tack that username on to the end of your requests. That gives you 20k credits per day, which in most instances equates with 1 request per credit. I recommend downloading one of their prepackaged country files first, to give you a sense for how the records are structured and what attributes are available. A readme file that describes all of the available fields accompanies each download.
1st Level Admin Divisions for Dominica from the Geonames website
My goal was to get all administrative divisions – names and codes and how the divisions nest within each other – for all of the countries in the French-speaking Caribbean (countries that are currently, or formerly, overseas territories of France). I also needed to get place names as they’re written in French. I’ll walk through my Python script that I’ve pasted below.
import requests,csv
from time import strftime

ccodes=['BL','DM','GD','GF','GP','HT','KN','LC','MF','MQ','VC']
fclass='A'
lang='fr'
uname='REQUEST FROM GEONAMES'

#Columns to keep
fields=['countryId','countryName','countryCode','geonameId','name','asciiName',
        'alternateNames','fcode','fcodeName','adminName1','adminCode1',
        'adminName2','adminCode2','adminName3','adminCode3','adminName4','adminCode4',
        'adminName5','adminCode5','lng','lat']
fcode=fields.index('fcode')

#Divisions to keep
divisions=['ADM1','ADM2','ADM3','ADM4','ADM5','PCLD','PCLF','PCLI','PCLIX','PCLS']

base_url='http://api.geonames.org/searchJSON?'

def altnames(names,lang):
    "Given a dict of names, extract preferred names for a given language"
    aname=''
    for entry in names:
        if 'isPreferredName' in entry.keys() and entry['lang']==lang:
            aname=entry.get('name')
        else:
            pass
    return aname

places=[]
tossed=[]

for country in ccodes:
    data_url = f'{base_url}?name=*&country={country}&featureClass={fclass}&lang={lang}&style=full&username={uname}'
    response=requests.get(data_url)
    data=response.json() #total retrieved and results in list of dicts
    gnames=response.json()['geonames'] #create list of dicts only
    gnames.sort(key=lambda e: (e.get('countryCode',''),e.get('fcode',''),
                               e.get('adminCode1',''),e.get('adminCode2',''),
                               e.get('adminCode3',''),e.get('adminCode4',''),
                               e.get('adminCode5','')))
    for record in gnames:
        r=[]
        for f in fields:
            item=record.get(f,'')
            if f=='alternateNames' and f !='':
                aname=altnames(item,'en')
                r.append(aname)
            else:
                r.append(item)
        if r[fcode] in divisions: #keep certain admin divs, toss others
            places.append(r)
        else:
            tossed.append(r)

filetoday=strftime('%Y_%m_%d')
outfile='geonames_fwi_adm_'+filetoday+'.csv'

writefile=open(outfile,'w', newline='', encoding='utf8')
writer=csv.writer(writefile, delimiter=",", quotechar='"',quoting=csv.QUOTE_NONNUMERIC)
writer.writerow(fields) #header row
writer.writerows(places)
writefile.close()

print(len(places),'records written to file',outfile)
First, I identify all of the variables I need: the two-letter ISO codes of the countries, a list of the Geonames attributes that I want to keep, the two-letter language code, and the specific feature type I’m interested in. There are different features codes classified with a single letter, and a number of subtypes below that. Feature class A is for records that represent administrative divisions, and within that class I needed records that represented the country as a whole (PCL codes) and its subdivisions (ADM codes). There are several different place name variables that include official names, short forms, and an ASCII form that only includes characters found in the Latin alphabet used in English. The language code that you pass into the url will alter these results, but you still have the option to obtain preferred place names from an alternate languages field. The admin codes I’m retrieving are the actual admin codes; you can also opt to retrieve the unique Geonames integer IDs for each admin level, if you wanted to use these for bridging places together (not necessary in my case).
There are a few different approaches for achieving this goal. I decided to use the Geonames full text search, where you search for features by name (separate APIs for working with hierarchies for parent and child entities are another option). I used an asterisk as a wildcard to retrieve all names, and the other parameters to filter for specific countries and feature classes. At the end of the base url I added JSON for the search; if you leave this off the records are returned as XML.
base_url='http://api.geonames.org/searchJSON?'
My primary for loop loops through each country, and passes the parameters into the data url to retrieve the data for that country: I pass in country code, feature class A, and French as the language for the place names. It took me a while to figure out that I also needed to add style=full to retrieve all of the possible info that’s available for a given record; the default is to capture a subset of basic information, which lacked the admin codes I needed.
I use the Python Requests module to interact with the API. Geonames returns two objects in JSON: an integer count of the total records retrieved, and another JSON object that essentially represents a list of python dictionaries, where each dictionary contains all the attributes for a record as a series of key and value pairs where the key is the attribute name (see examples below). I create a new gnames variable to isolate just this list, and then I sort the list based on how I want the final output to appear; by country and by admin codes, so that like-levels of admin codes are grouped together. The trick of using lamba to sort nested lists or dictionaries is well documented, but one variation I needed was to use the dictionary get method. Some features may not have five levels of admin codes; if they don’t then there is no key for that attribute, and using the simple dict[key] approach returns an error in those cases. Using dict.get(key,”) allows you to pass in a default value if no key is present. I provide a blank string as a placeholder, as ultimately I want each record to have the same number of columns in the output and need the attributes to line up correctly.
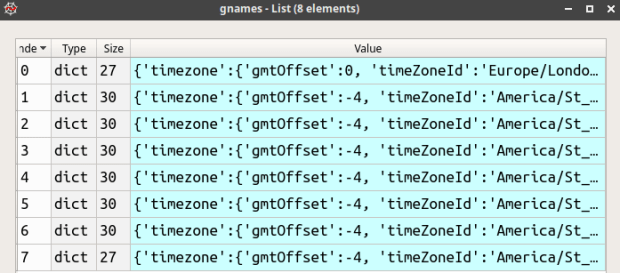
Records returned from Geonames as a list, where each list item is a dictionary of key / value pairs for a given place
Example of an individual list item, a dictionary of key / value pairs for the Parish of Charlotte, a 1st order admin division of Saint-Vincent-et-les-Grenadines. Variable names are keys.
Once I have records for the first country, I loop through them and choose just the attributes that I want from my field list. The attribute name is the key, I get the associated value, but if that key isn’t present I insert an empty string. In most cases the value associated with a key is a string or integer, but in a few instance it’s another container, as in the case of alternate names which is another list of dictionaries. If there are alternate names I want to pull out a preferred name in English if one exists. I handle this with a function so the loop looks less cluttered. Lastly, if this record represents an admin division or is a country-level record then I want to keep it, otherwise I append it to a throw-away list that I’ll inspect later.
Once the records returned for that country have been processed, we move on to the next country and keep appending records to the main list of places (image below). When we’re done, we write the results out to a CSV file. I write the list of fields out first as my header row, and then the records follow.
Final list called places that contains records for all admin divisions for specific countries and feature classes, where items are sublists that represent each place
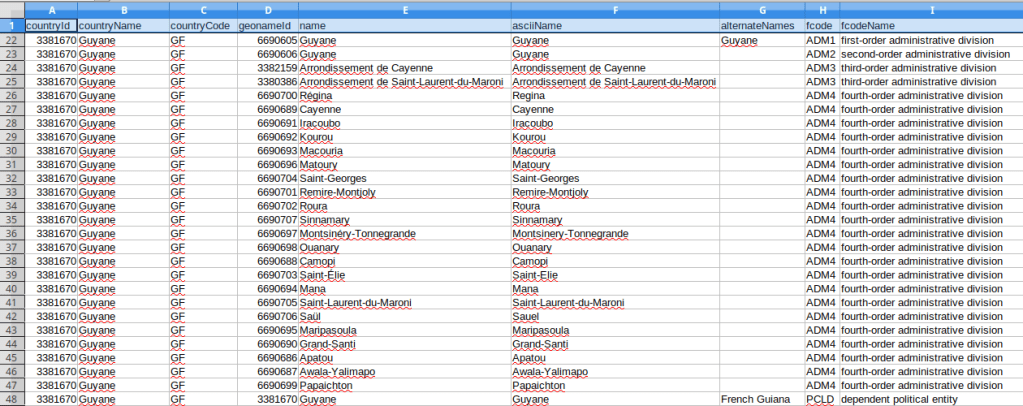
Overall I think this approach worked well, but there are some small caveats. A number of the countries I’m studying are not independent, but are dependencies of France. For dependent countries, their 1st and sometimes even 2nd level subdivision codes appear identical to their top-level country code, as they represent a subdivision of an independent country (many overseas territories are departments of France). If I need to harmonize these codes between countries I may have to adjust the dependencies. The alternate English places names always appear for the country-level record, but usually not below that. I think I’d need to do some additional tweaking or even run a second set of requests in English if I wanted all the English spellings; for example in French many compound place names like Saint-Paul are separated by a hyphen, but in English they’re separated by a space. Not a big deal in my case as I was primarily interested in the alternate spellings for countries, i.e. Guyane versus French Guiana. See the final output below for Guyane; these subdivision codes are from INSEE COG, which are the official codes used by the French government for identifying all geographic areas for both metropolitan France and overseas departments and collectivities.
1st half of CSV file imported into spreadsheet, records showing admin divisions of Guyane / French Guiana
2nd half of CSV file imported into spreadsheet, records showing admin codes and hierarchy of divisions for Guyane / French Guiana
Two final things to point out. First, my script lacks any exception handling, since my request is rather small and the API is reliable. If I was pulling down a lot of data I would replace my main for loop with a try and except block to handle errors, and would capture retrieved data as the process unfolds in case some problem forces a bail out. Second, when importing the CSV into a spreadsheet or database, it’s important to import the admin codes as text, as many of them have leading zeros that need to be preserved.
This example represents just the tip of the iceberg in terms of things you can do with Geonames APIs. Check it out!
This month’s post is a bit shorter, as I have just two announcements I wanted to share about some resources I’ve created.
First, I’ve written a short technical paper that’s just been published as part of the Weissman Center of International Business’ Occasional Papers Series. Exploring US Census Datsets: A Summary of Surveys and Sources provides an overview of several different datasets (decennial census, American Community Survey, Population Estimates Program, and County Business Patterns) and sources for accessing data. The paper illustrates basic themes that are part of all my census-related talks: the census isn’t just the thing that happens every ten years but is an ecosystem of datasets updated on an on-going basis, and there are many sources for accessing data which are suitable for different purposes and designed for users with varying levels of technical skill. In some respects this paper is a super-abridged version of my book, designed to serve as an introduction and brief reference.
Second, I’ve created a series of introductory notebooks on GitHub that illustrate how to use the Census Bureau’s API with Python and Jupyter Notebooks. I designed these for a demonstration I gave at NYU’s Love Data Week back on Feb 10 (the slides for the talk are also available in the repo). I structured the talk around three examples. Example A demonstrates the basics of how the API works along with some best practices, such as defining your variables at the top and progressively building links to retrieve data. It also illustrates the utility of using these technologies in concert, as you can pull data into your script and process and visualize it in one go. I also demonstrate how to retrieve lists of census variables and their corresponding metadata, which isn’t something that’s widely documented. Example B is a variation of A, extended by adding an API key and storing data in a file immediately after retrieval. Example C introduces more complexity, reading variables in from files and looping through lists of geographies to make multiple API calls.
Since I’ve written a few posts on the census API recently, I went back and added an api tag to group them together, so you can access them via a single link.
Define census API variables, build links, and retrieve data


You must be logged in to post a comment.